
Small Gambling Addiction Spending Visual
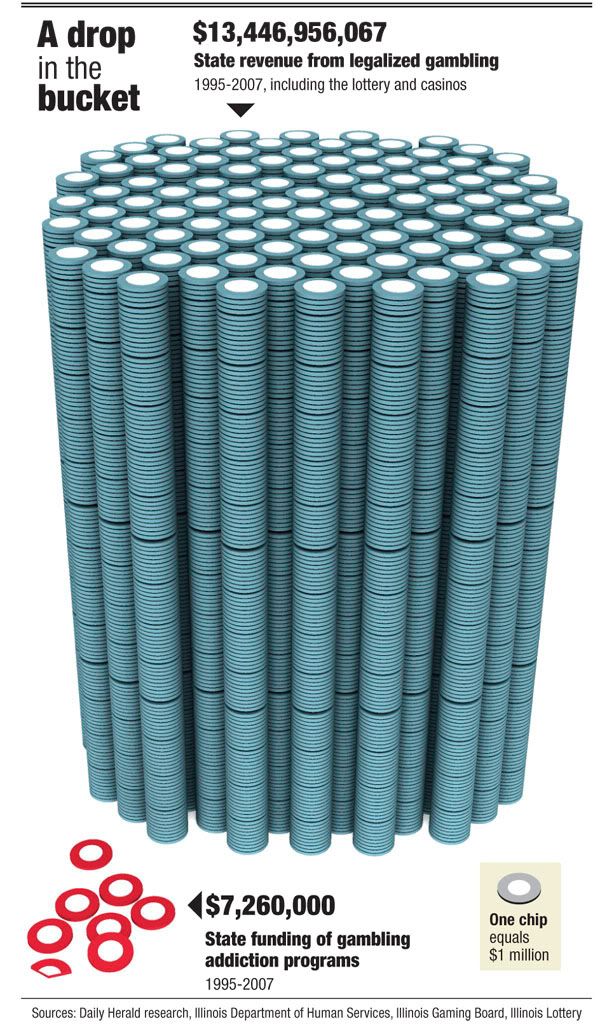
I love this very simple but powerful visual comparison of the gambling revenues and the money spent on gambling addiction support programs. The author is only trying to communcate one point, and gets his message across very stongly. I believe it was done by Tim Broderick, from the Daily Herald.
Found on InfographicsNews.blogspot.com. Looks like


Definitely a nice info graphic. You know they really don't care about the people who just lost their house and family to gambling on slots, blackjack, sportsbook and craps. I would have thought the divide would have been smaller, but it doesn't really surprise me.
ReplyDeleteI realize it would be going against the author's objective (hopefuly), but I'd really like to see an animation or some iteration that could show me both how effective those 7 and a half chips of investments in gambling addiction programms have been over the years and how much they've grown.
ReplyDeleteBy showing each year or semesters in a separate frame, perhaps, we could have an idea of how much money people have spent in gambling and if there's any growth or diminish in those chips stacks over time...
Great idea, though!
great website you have here. For all sorts of gambling information like on gambling addiction, visit my blog at http://gamblinganon.blogspot.com
ReplyDelete