Showing posts with label budget. Show all posts

Monday, October 5, 2009

The Billion Dollar Gram


This is one of those simple, but great infographics.  Once the news starts talking about "billions" of dollars, the brain goes numb and it all runs together because the numbers are too big for us to comprehend.

David McCandless, from Information Is Beautiful, created this tree map to show the relative size of the different billion dollar spending and budgets in the news.

Great job David, keep them coming!


Tuesday, August 4, 2009

NEW Death and Taxes 2010 poster!!


First, Jess from WallStats.com has released the 2010 Death & Taxes poster.  This is one of the best infographic examples today.  It's extremely informative, and the topic has a very wide reach.  The Death & Taxes poster from 2007 was my initial post on Cool Infographics, so I'm very excited to see this update.   Now the 2010 version is available to purchase as a poster here. Great job Jess!

Second, I'm really impressed by the viewer code for the poster. It's from Zoomorama.com, and lets me embed the interactive viewer.  The built-in zoom is pretty nice, but the Quick Find index on the left side is the best part.


Friday, July 24, 2009

One Trillion Dollars Visualized [infographic video]


New video based on the infographics from our friend, Jess Bachman, from WallStats.com!  Created by/for Mint.com.

Trillion is the new Billion!

Wednesday, July 22, 2009

Obama's Credit Card Statement

Here's another one I found while I was checking out gimmiethescoop.com. From Tyler Shears, this one visualizes the last six months of Federal Reserve debt as a credit card bill.

Monday, July 20, 2009

The American Dream/Nightmare


I really like this one from gimmiethescoop.com.  It's pretty simple (it's a 3D column chart), but it get's it's point across well.  The accumulated debt for the average American continues to outpace their annual income.  The concept of living beneath your means is foreign to a lot of people.

Found a link on nerdmodo.com

Wednesday, April 22, 2009

How do College Students Spend Money?


 I certainly don't remember having 40% of my budget as "discretionary" when I was in college!


This is from the Westwood College website, but I don't see a specific creator listed.

Thursday, March 12, 2009

Visualizing the Stimulus Bill


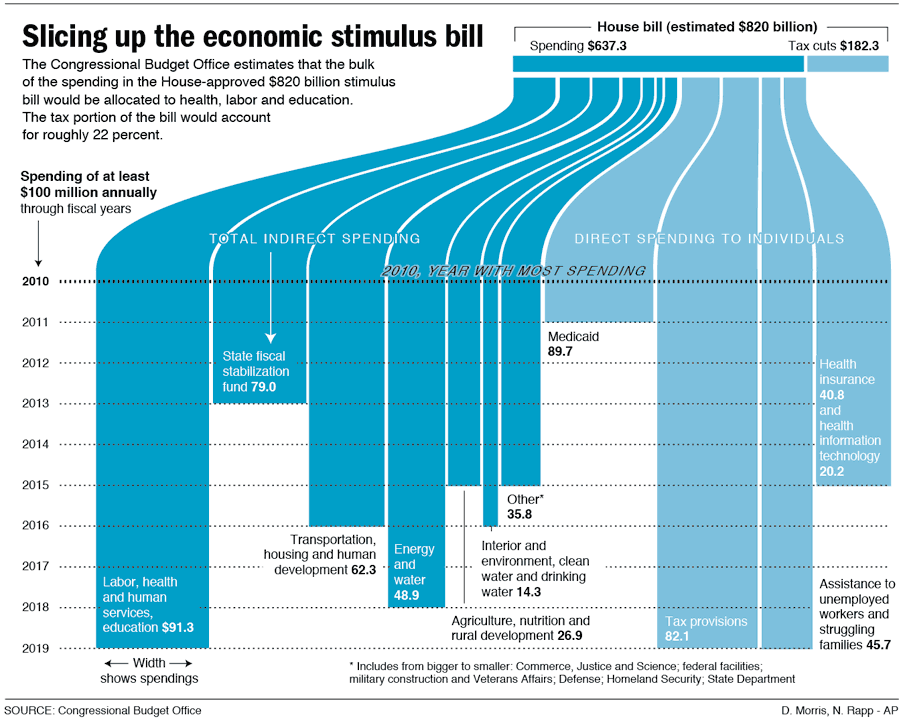
Here's a great, simple graphic that breaks down the stimulus bill.

Nicholas Rapp does some great infographic design work.  Check out some of his other work at nicolasrapp.com

Wednesday, February 25, 2009

Taking Apart the $819B Stimulus Package


Very detailed infographic from the Washington Post showing how the proposed stimulus package is broken out between ares of spending and tax cuts.

The centerpiece of President Obama's domestic agenda is an $819 billion economic stimulus plan. The Senate will consider the measure this week, with an eye toward the amount of tax cuts and spending. Republicans and Democrats spar over what to consider a tax cut. An analysis by the nonpartisan Congressional Budget Office tallies the tax-cut portion to be significantly less than the one-third Democrats claim it to be.

SOURCE: Congressional Budget Office | Reporting by Karen Yourish, graphic by Laura Stanton - The Washington Post - February 01, 2009

Monday, January 26, 2009

Modern Day Pirates


Pirates infographic from the Russian News and Information Agency.  These are real pirates at sea (not online pirates stealing software, music and movies).  433 victims and 292 kidnappings in 2007! (EDITED: there were only 5 deaths, not 433)
Article 100 of the United Nations Convention on the Law of the Sea (UNCLOS) requires that all states fight against piracy.  The annual damage from piracy to the global economy is around 15 billion Euros ($12 Billion).
This one and many other infographics are available online at the Russian News and Information Agency's infographics page.

Monday, December 8, 2008

The Hidden Cost of War


Found on both Information Aesthetics and Visualizing Econmics.

Monday, November 17, 2008

A Visual Guide to the Financial Crisis


This is a tall flow chart helping describe the financial crisis, from blog.mint.com.

Thanks Alwyn!

Monday, November 3, 2008

Where your Apple Tax goes...


A little humor Monday morning from the brilliant minds behind The Joy of Tech.  Click the link to see the full version.

Wednesday, October 22, 2008

It's the Economy, Stupid!


Great timeline from GOOD Magazine (via picdit.com).
What most of the doom-and-gloom reports on our economy don’t provide is perspective—a historical survey of an economy that’s been through more than a few ups and downs in its day. Here’s a farsighted view of how our temperamental economic machine works, and a close-up of how it stands today.
Thanks Adam!

Monday, October 20, 2008

NEW Death and Taxes 2009 poster


New Death and Taxes infographic for 2009!  Interactive viewer let's you zoom in to see all of the details.
"Death and Taxes:2009" is a representational poster of the federal discretionary budget; the amount of money that is spent at the discretion of your elected representatives in Congress. Basically, your federal income taxes. The data is from the President's budget request for 2009. It will be debated, amended, and approved by Congress by October 1st to begin the fiscal year.

The poster provides a uniquely revealing look at our national priorities, that fluctuate yearly, according to the wishes of the President, the power of Congress, and the will of the people. If you pay taxes, then you have paid for a small part of everything in the poster. 
The Death and Taxes poster from 2007 was my initial post on Cool Infographics, so I'm very excited to see this update.  Now the 2009 version is available to purchase as a poster here.

Friday, August 15, 2008

National Debt and the Presidents


First, I'm not pushing any particular political agenda.  There's considerable debate around this chart, so I don't want to start any arguments.  The debate isn't around the validity of the data, but about how it's being presented.  The information is freely available from the U.S. Department of the Treasury and the Bureau of the Public Debt.


Second, I like that this chart takes a simple bar chart and adds a few more layers of information.  At its root, this is a timeline of the increase in the national debt based on the federal budget by year.  Then layered on top of that are the presidents in office that year, some color coding, the political party controlling the White House and highlights for record years.


Third, just to share the reasons for the debate.  This is a great example of data being visualized with a specific agenda in mind.  Obviously, this is a chart framed to make Republicans look bad, and Democrats look good.  The debate centers around a few issues like programs started by one President will carry into the term of another President and more importantly that the political party controlling Congress actually has more impact on the federal budget than the President does.

Friday, August 1, 2008

Small Gambling Addiction Spending Visual


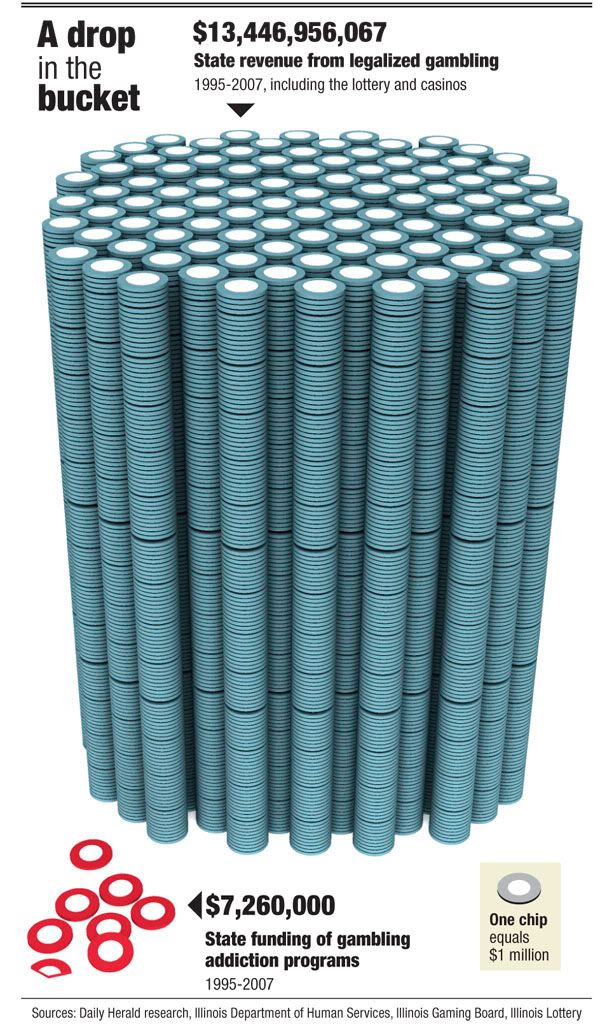
I love this very simple but powerful visual comparison of the gambling revenues and the money spent on gambling addiction support programs.  The author is only trying to communcate one point, and gets his message across very stongly.  I believe it was done by Tim Broderick, from the Daily Herald.


Found on InfographicsNews.blogspot.com.  Looks like

Monday, June 23, 2008

Obama Funding Graphic


A small poster from our friends at XPLANE,
How Obama Reinvented Campaign Finance Barack Obama is the first major candidate to decline participation in the public financing system for presidential campaigns. He’s found a more effective way to raise money — by leveraging the power of the American people through online Social Networks.
Available as a PDF formatted for printing on 11x17 paper.

Monday, June 16, 2008

The Cost of Gadgets


From Wired.com, this is really a 3-dimensional chart. I liked it because there are very few 3D charts that actually portray 3 dimensions of data. (This is actually 4D if you include the different products as a dimension) Usually 3D charts are just bad use of chart styles from PowerPoint. I also like the perspective from above. Although unusual, it helps to see the whole chart.

Monday, May 5, 2008

Where Does the Money Go?


From the nytimes.com, this graphic visually represents how average consumer spending breaks down, and the color code shows how much spending in that category has changed in the last year. For example, Gasoline is 5.2% of an average consumer's spending, and it has risen 26% from 2007 to 2008.

As far as I can tell, this is actually a treemap, but in a new shape. More details pop-up when you mouse over each of the individual shapes.

Thanks to Tony, for sending in the link.

Tuesday, January 22, 2008

Nichloas Felton's 2007 Annual Report


Nicholas Felton has published his new 2007 Annual Report. I love the way he breaks down his own personal life into maps and charts. I had just posted about his 2006 Annual Report last month.