Friday, August 29, 2008

Sony Walkman advertising


This may cross the lines between infographics, advertising and art, but I really liked these advertising posters.  They're real subway maps of New York, London and Sydney, with a little artistic twist to add the ear buds.


I found these on Ad Goodness, and they were created by Saatchi & Saatchi.

Thursday, August 28, 2008

VizThink Europe Discount Code!


I know many of my readers would really enjoy the conference VizThink Europe, and the conference is coming up quickly.  The Europe version is in Berlin, Germany this year on October 12-14 at Crown Plaza Berlin City Centre.
We'll have lots of opportunities for hands on experiences, learning from industry gurus, and networking with your visual thinking peers. We'll be bringing a few of your favorite facilitators from San Francisco with all new content, plus a whole lot of new facilitators from Europe.
The great guys at VizThink have created a discount code for readers of Cool Infographics.  Use the code BCRK01 when you register to get €50 ($75-$80 in U.S. dollars these days) off any regular attendance fee (not student, Government or non-profit rates).

If you can get to Berlin (and I have a lot of readers from Europe), you would really get a lot from attending.

Big thanks to the guys at VizThink!

Saturday, August 23, 2008

Olympic Wrap-Up


To complete the week of Olympic Infographics from the NYTimes.com, they have created a page to summarize all of the infographics they created.  They've been adding to it every day, so it won't actually be complete until the Olympics are over.

Friday, August 22, 2008

Beijing Air Quality Index


NYTimes.com is also tracking the Air Quality Index by day during the Olympics using a heatmap style graphic.  There's definitely more pollution and particles in the air than most of the participants are used to.  So far, there have been a couple of days in the 90's, but didn't cross over 100 into the "unhealthy" range.

Thursday, August 21, 2008

Olympic Maps of Beijing


Let's not forget the Maps!  NYTimes.com has a number of interactive maps of the Beijing area showing the event locations, new architecture built for the Olympics, the demolition and expansion of the old city over the last 10 years, the new subway routes and some of the routes for the marathon and cycling events.

Wednesday, August 20, 2008

Olympics Schedule Tracker


The Olympics Tracker is an interactive schedule of the events.  It now only shows which events are scheduled each day and hour, but you can drag them to rearrange your favorites to the top.  Clicking on past events shows the results, and clicking on future events shows the upcoming event details.  Medal awarding events marked with a small medal icon.  You can even download a desktop version for Mac or Windows.

Tuesday, August 19, 2008

Olympic History of World Records


The History of World Records from NYTimes.com shows how the world record in a number of Summer Olympic events has progressively been beaten over the last 100 years.  In this chart, the Men's 100m Freestyle record was beaten three times this year improving the world record by 0.45 seconds.  Similar events are all charted together, so you can see other freestyle events on the same chart.

Monday, August 18, 2008

Olympics Medal Count Map


The Medal Count Map from the NYTimes.com show the total number of medals each country has won in every olympics since 1896.  Choose a year on the timeline to animate the graphic.  Rolling your mouse over a country will show the breakdown of Gold, Silver and Bronze medals and clicking will bring up a complete list of the events and medal winners.

Sunday, August 17, 2008

Evolution of Olympic Torches


The group at the NY Times online has been working overtime to create a bunch of infographics as part of their coverage of the 2008 Olympics.  I'm going to highlight them this week with many of the graphics they've created.  Their graphics are coming our rapid-fire just like the events in China.

First up is an Olympic Torch History graphic, highlight the torch designs since 1936 for both the Summar and Winter Olympic Games.   Roll over each torch to see deatils behind the design.

Friday, August 15, 2008

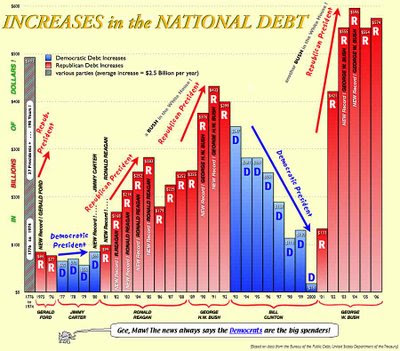
National Debt and the Presidents


First, I'm not pushing any particular political agenda.  There's considerable debate around this chart, so I don't want to start any arguments.  The debate isn't around the validity of the data, but about how it's being presented.  The information is freely available from the U.S. Department of the Treasury and the Bureau of the Public Debt.


Second, I like that this chart takes a simple bar chart and adds a few more layers of information.  At its root, this is a timeline of the increase in the national debt based on the federal budget by year.  Then layered on top of that are the presidents in office that year, some color coding, the political party controlling the White House and highlights for record years.


Third, just to share the reasons for the debate.  This is a great example of data being visualized with a specific agenda in mind.  Obviously, this is a chart framed to make Republicans look bad, and Democrats look good.  The debate centers around a few issues like programs started by one President will carry into the term of another President and more importantly that the political party controlling Congress actually has more impact on the federal budget than the President does.

Wednesday, August 13, 2008

BBC World Food Prices


The BBC online has a site dedicated to charting food prices around the world called : The cost of food: Facts and figures.  Mostly simple charts, but they've found a handful of really good information.  They could make these prettier, but they get the message across.  Each chart tells a simple story.

Monday, August 11, 2008

Awesome Medical Visualizations


Really neat promotional video for Hybrid Medical Animation.  These guys do some amazing work.

Friday, August 8, 2008

The Ropes at Disney


Found on CartoonBrew, this circular chart from 1943 shows the development process of an animated film through the different roles within the Disney organization.  Not exactly an org chart, this is more of a process map.

How do they make those drawings move?  This chart, an separate pull-out from the 1943 booklet, The Ropes At Disney’s (see below), explains the whole process.You’ll note that it all starts with “Walt”. And his main focus was “Story” and “Direction”.
Can you tell I'm going to Walt Disney World today?

Wednesday, August 6, 2008

Visual Baby Name Trends site


NameTrends.net is a fantastic interactive site that charts and maps the popularity of baby names over the last century in the U.S.  You can look at the most popular names, or search for specific names to see their results.  The chart above shows the top 20 baby names from the 2000's decade (10 boys and 10 girls).  You can see that those names also had some popularity at the end of the 19th century.


The site also allows you to map the name popularity by state.  The slider across the top allows you to see the geographic distribution by year.


Found on Information Aesthetics.

Monday, August 4, 2008

The Art of Visual Thinking


Last week, Guy Kawasaki posted a good interview with Dan Roam on his blog.

Do you recognize this picture? It's how Southwest Airlines was pitched.
To provide more insight into the process of visual thinking, I tapped Dan Roam. He is the author of The Back of the Napkin: Solving Problems and Selling Ideas with Pictures . In this interview he explains why and how to use visual thinking in your business. Click here to read it. To learn even more about visual thinking, be sure to read his book.

Friday, August 1, 2008

Small Gambling Addiction Spending Visual


I love this very simple but powerful visual comparison of the gambling revenues and the money spent on gambling addiction support programs.  The author is only trying to communcate one point, and gets his message across very stongly.  I believe it was done by Tim Broderick, from the Daily Herald.


Found on InfographicsNews.blogspot.com.  Looks like