Monday, August 31, 2009

Best Beer in America: 2009 Update!


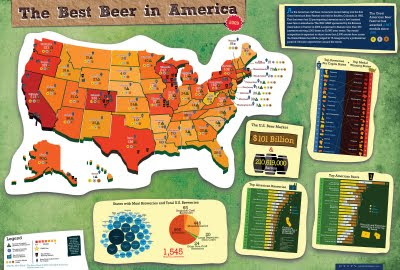
Our friend, Mike Wirth, has released the 2009 Great American Beer Festival Medal Map, but it's much easier to call it the Best Beer in America Map!

Mike uses the data of the Great American Beer Festival medal winners from 1987-2008, and this year he has added some new infographics to help support the map.  If you live in Oklahoma or North Dakota, I hope you're drinking out-of-state beer!  I'm just saying.

I posted about his original poster here.  The infographic was published on the Lyke2Drink blog, and on Mike's own website.

Nice work Mike!

Thursday, August 27, 2009

Beer Comparison: Porter vs. Stout (100% more infographic)


For those of us that enjoy dark beer, it may come as a surprise that there really is a technical difference between a porter and a stout beer.  The guys over of GeekBeer.com have attempted to explain it, along with this great infographic by Ethan John.  Ethan was kind enough to put the images up on his Flickr Photostream.

Great job Ethan!

Wednesday, August 26, 2009

What is the GDP per Capita for Every Country?


Cool interactive chart on Snippets.com that shows the GDP per Capita of every country (so it claims).  It has a number of predefined groupings like Continent, UN Members, OPEC, Communist, Largest Area, etc to show comparisons.
The interactive chart below represents the GDP per capita for each country. Click on any of the buttons to view the data for that particular group of nations. You can highlight a particular country by selecting it in the dropdown box.  The data was compiled from the 2008 CIA World Factbook.

Thanks for the link Jerry!

Tuesday, August 25, 2009

U.S. Energy Use Decreases in 2008 [infographic]


Infographic from the Lawrence Livermore National Laboratory, this is their estimate for the total U.S. Energy Consumption for 2008.  Although not depicted in the graphic, their estimate for energy usage dropped by 2% from 2007 to 2008, and use of alternative energy sources like wind and solar increased.

Found on CleanTechnica.com

Estimated U.S. Energy use dipped in 2008 to 99.2 quads (quadrillion BTUs), down from 101.2 quads in 2007. Energy flow charts show the relative size of primary energy resources and end uses in the United States, with fuels compared on a common energy unit basis. The amount of energy in one quad is equivalent to that produced by the burning of 36,000,000 tonnes of coal.

Monday, August 24, 2009

Big Bang Briefly [video]


A new video on YouTube that visually tries to help explain the Big Bang and the creation of the universe.  Narrated by Dr. Janna Levin.  Maybe a little more on the visual illustration side than infographic, but still good.
"We made this video about the Big Bang because the theory is important and amazing, but often misunderstood.

This video was produced without any funding from any outside sources. It was put together with donated creative time from a group with a desire to further public cognition of science

Science has many amazing stories to tell, this is the first. The Big Bang Briefly."
 Found on VizWorld.com

Saturday, August 22, 2009

Create Your Own Facebook Network Graph


Create a graph of your own network of friends on Facebook with Nexus.  You've seen many visuals of Twitter and Facebook connections, but this one is especially cool because it's your own network.  That's my network chart is above, but you don't care about mine...go create your own!

Found on Twitter

Tuesday, August 18, 2009

American health care on (4) napkins


Dan Roam, author of Back of the Napkin, has posted a napkin explanation of the American Health Care debate on his blog.  It took him 4 napkins to complete his explanation, but I think he did a really good job trying to help people understand a very complex issue.

He has also published a slideshow of the complete series up on SlideShare.net


Check out Dan's great book, Back of the Napkin.


Wednesday, August 12, 2009

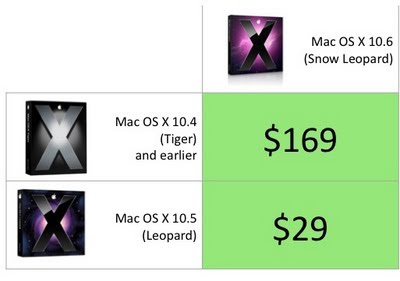
Mac OS X Snow Leopard Upgrade Chart


In contrast here's my version of the Mac OS X Snow Leopard upgrade chart.  The comparison to the Mac was inevitable, and I couldn't find that anyone else had created this chart yet.

The $169 price for users that don't have Leopard also include iLife and iWork.

Improved Microsoft Windows 7 Upgrade Chart

The chart above is NOT from Microsoft.  Ed Bott, over at ZDNet, was able to quickly redesign the Windows 7 Upgrade Chart from Microsoft in about an hour.  And Ed's a journalist.

The original chart (below) is unnecessarily complicated and hard to comprehend.  I generally don't post about bad infographics, but in this case Ed was able to re-do Microsoft's chart into the improved, simpler version you see above. 

Honestly, the upgrade process is still too complicated and Microsoft should be ashamed of themselves.  This deserves a new Mac vs. PC ad just by itself.

Found on Engadget and All Things D.

Here's the official "horrendous" (I don't get to use that word often) chart from Microsoft.

Monday, August 10, 2009

What is Your Wine Personality?


From the Texas Department of Agriculture at GoTexanWine.org, the Wine Personality Wheel comes from the Texas in a Bottle guide to Texas Wine (download as a pdf).  I love the sense of humor.
Ever listen to somebody describe a wine?  They talk about it having "character" and "personality."  To hear them tell it, wines are a lot like people.  We've talked it over and came to a conclusion - they have it backwards.  People are a lot like wines.
Here at the Viticultural Personality Institute, we've compiled a fun list of personality types based on wine preferences.
If your favorite wine listed here does not accurately reflect your particular personality, please choose another favorite wine (or change your personality - otherwise, you'll make our researchers look bad).

Looking around the GoTexanWine.org site, I also found a good, animated timeline (link) of the history of wine in Texas.


Eight federally approved Viticultural Areas currently exist in Texas. Eighty-five percent of wine from a Viticultural Area must be made from grapes grown within the area's boundaries. If the wine is a varietal, 75 percent of that wine must be made from the designated grape variety.

Tuesday, August 4, 2009

NEW Death and Taxes 2010 poster!!


First, Jess from WallStats.com has released the 2010 Death & Taxes poster.  This is one of the best infographic examples today.  It's extremely informative, and the topic has a very wide reach.  The Death & Taxes poster from 2007 was my initial post on Cool Infographics, so I'm very excited to see this update.   Now the 2010 version is available to purchase as a poster here. Great job Jess!

Second, I'm really impressed by the viewer code for the poster. It's from Zoomorama.com, and lets me embed the interactive viewer.  The built-in zoom is pretty nice, but the Quick Find index on the left side is the best part.