Showing posts with label taxes. Show all posts

Tuesday, August 4, 2009

NEW Death and Taxes 2010 poster!!


First, Jess from WallStats.com has released the 2010 Death & Taxes poster.  This is one of the best infographic examples today.  It's extremely informative, and the topic has a very wide reach.  The Death & Taxes poster from 2007 was my initial post on Cool Infographics, so I'm very excited to see this update.   Now the 2010 version is available to purchase as a poster here. Great job Jess!

Second, I'm really impressed by the viewer code for the poster. It's from Zoomorama.com, and lets me embed the interactive viewer.  The built-in zoom is pretty nice, but the Quick Find index on the left side is the best part.


Wednesday, July 22, 2009

Obama's Credit Card Statement

Here's another one I found while I was checking out gimmiethescoop.com. From Tyler Shears, this one visualizes the last six months of Federal Reserve debt as a credit card bill.

Thursday, March 12, 2009

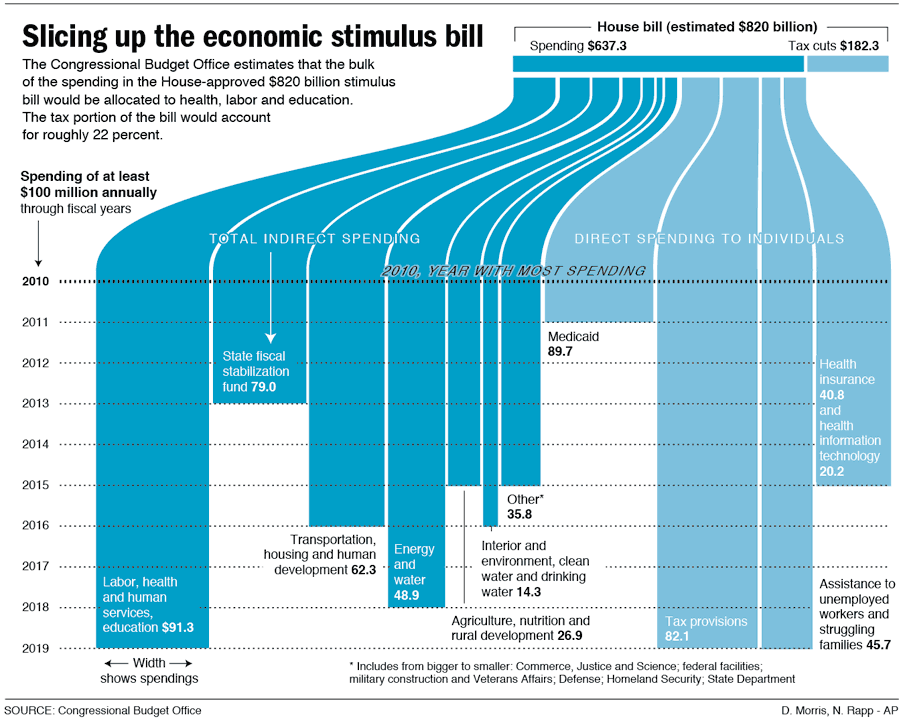
Visualizing the Stimulus Bill


Here's a great, simple graphic that breaks down the stimulus bill.

Nicholas Rapp does some great infographic design work.  Check out some of his other work at nicolasrapp.com

Wednesday, February 25, 2009

Taking Apart the $819B Stimulus Package


Very detailed infographic from the Washington Post showing how the proposed stimulus package is broken out between ares of spending and tax cuts.

The centerpiece of President Obama's domestic agenda is an $819 billion economic stimulus plan. The Senate will consider the measure this week, with an eye toward the amount of tax cuts and spending. Republicans and Democrats spar over what to consider a tax cut. An analysis by the nonpartisan Congressional Budget Office tallies the tax-cut portion to be significantly less than the one-third Democrats claim it to be.

SOURCE: Congressional Budget Office | Reporting by Karen Yourish, graphic by Laura Stanton - The Washington Post - February 01, 2009

Wednesday, October 22, 2008

It's the Economy, Stupid!


Great timeline from GOOD Magazine (via picdit.com).
What most of the doom-and-gloom reports on our economy don’t provide is perspective—a historical survey of an economy that’s been through more than a few ups and downs in its day. Here’s a farsighted view of how our temperamental economic machine works, and a close-up of how it stands today.
Thanks Adam!

Monday, October 20, 2008

NEW Death and Taxes 2009 poster


New Death and Taxes infographic for 2009!  Interactive viewer let's you zoom in to see all of the details.
"Death and Taxes:2009" is a representational poster of the federal discretionary budget; the amount of money that is spent at the discretion of your elected representatives in Congress. Basically, your federal income taxes. The data is from the President's budget request for 2009. It will be debated, amended, and approved by Congress by October 1st to begin the fiscal year.

The poster provides a uniquely revealing look at our national priorities, that fluctuate yearly, according to the wishes of the President, the power of Congress, and the will of the people. If you pay taxes, then you have paid for a small part of everything in the poster. 
The Death and Taxes poster from 2007 was my initial post on Cool Infographics, so I'm very excited to see this update.  Now the 2009 version is available to purchase as a poster here.

Friday, August 15, 2008

National Debt and the Presidents


First, I'm not pushing any particular political agenda.  There's considerable debate around this chart, so I don't want to start any arguments.  The debate isn't around the validity of the data, but about how it's being presented.  The information is freely available from the U.S. Department of the Treasury and the Bureau of the Public Debt.


Second, I like that this chart takes a simple bar chart and adds a few more layers of information.  At its root, this is a timeline of the increase in the national debt based on the federal budget by year.  Then layered on top of that are the presidents in office that year, some color coding, the political party controlling the White House and highlights for record years.


Third, just to share the reasons for the debate.  This is a great example of data being visualized with a specific agenda in mind.  Obviously, this is a chart framed to make Republicans look bad, and Democrats look good.  The debate centers around a few issues like programs started by one President will carry into the term of another President and more importantly that the political party controlling Congress actually has more impact on the federal budget than the President does.

Friday, November 2, 2007

The President's Entourage


Found on Digg, a quick graphic showing the massive entourage that travels with the President.

Sunday, July 22, 2007

Death and Taxes 2008

NEW Death and Taxes infographic for 2008!

It is the 2008 Federal discretionary budget of the United States. is a representational poster of the federal discretionary budget; the amount of money that is spent at the discretion of your elected representatives in Congress. Basically, your federal income taxes. The data is from the President's budget request for 2008. It will be debated, amended, and approved by Congress by October 1st to begin the fiscal year.
So this is what the President is asking for, not the final budget. Compare this to the final 2007 discretionary budget from my earlier post.

An interactive Flash version is online at www.thebudgetgraph.com/poster.

Sunday, July 15, 2007

Death and Taxes 2007


One of my favorite infographics is the Death and Taxes series.

This infographic visually breaks down the US Federal Discretionary Budget for 2007 into smaller and smaller bubbles. The actual values are also included as text, but the size of the bubbles instantly gives you an understanding of how the different budget items compare.

An online version in Flash is also available at thebudgetgraph.com

Just to be clear, this only shows the Discretionary Budget which totals $938 Billion. The total budget is $2.8 Trillion. Notice the circle in the background (just barely visible at the top and bottom) showing the National Debt of $9.35 Trillion.

One older version is the 2004 Budget.