Showing posts with label food. Show all posts

Friday, September 25, 2009

Infographic Stickers for your Walls


From Hu2 Design, cocktail recipe infographics for your wall (drink not included).  They've created different ones for Rum, Tequila, Whiskey, Gin and Vodka that show the drink recipes for the common mixed drinks.  They're also available in different colors to help coordinate with your wall colors, and the website lets you see the color graphics on different wall colors to find what you are looking for.
Hu2 Vinyl Stickers are designed to be applied to any smooth surface including walls, windows & furniture. The vinyl’s are completely removable and leave no residue.
Also available is a cocktail ingredients by percentage infographic.


They also have bath tub level indicators, cable organizers, and things not to be forgotten as you leave your house.  In addition to the infographic stickers, they offer a bunch of fun, decorative and well designed wall decals as well.  Go check them all out at Hu2.com

Thanks Romain!

EDIT: You can also follow Hu2Design on Twitter!


Thursday, August 27, 2009

Beer Comparison: Porter vs. Stout (100% more infographic)


For those of us that enjoy dark beer, it may come as a surprise that there really is a technical difference between a porter and a stout beer.  The guys over of GeekBeer.com have attempted to explain it, along with this great infographic by Ethan John.  Ethan was kind enough to put the images up on his Flickr Photostream.

Great job Ethan!

Monday, August 10, 2009

What is Your Wine Personality?


From the Texas Department of Agriculture at GoTexanWine.org, the Wine Personality Wheel comes from the Texas in a Bottle guide to Texas Wine (download as a pdf).  I love the sense of humor.
Ever listen to somebody describe a wine?  They talk about it having "character" and "personality."  To hear them tell it, wines are a lot like people.  We've talked it over and came to a conclusion - they have it backwards.  People are a lot like wines.
Here at the Viticultural Personality Institute, we've compiled a fun list of personality types based on wine preferences.
If your favorite wine listed here does not accurately reflect your particular personality, please choose another favorite wine (or change your personality - otherwise, you'll make our researchers look bad).

Looking around the GoTexanWine.org site, I also found a good, animated timeline (link) of the history of wine in Texas.


Eight federally approved Viticultural Areas currently exist in Texas. Eighty-five percent of wine from a Viticultural Area must be made from grapes grown within the area's boundaries. If the wine is a varietal, 75 percent of that wine must be made from the designated grape variety.

Thursday, July 23, 2009

Hellmann's - It's Time for Real [infographic video]


Thursday, June 11, 2009

Sugar Stacks: How Much Sugar is in your Food?


SugarStacks.com is a website dedicated to showing you how much sugar is in the food we eat.  Using a simple visual of stacked sugar cubes, you can see the sugar content of many different types of food.  I love that it's simple and visually gets one point across really well.  There are words on website, but you really don't need them.

We've used regular sugar cubes (4 grams of sugar each) to show how the sugars in your favorite foods literally stack up, gram for gram.  Compare foods, find out where sugar is hiding, and see how much of the sweet stuff you're really eating.

Found on Infosthetics.com, and as they note, the website doesn't differentiate between types of sugars, the white sugar cubes are used to represent them all.

Friday, May 15, 2009

Sushi Etiquette


This is from Food & Wine magazine (Sep 2005), and I've kept the hardcopy of this issue for the last four years because of this illustration.  I came across this magazine again today, so I thought I would share.  Apparently I eat sushi completely incorrectly, so I refer back occasionally to remind myself how to eat properly. (I love mixing the wasabi into my soy sauce!)

Here's the link to the original "Sushi In America" feature from the magazine.  You can find these and many other illustrations from Peter Arkle on his website.


Mmmm, fatty tuna is one of the best!

Friday, April 17, 2009

Where's The Beer? (U.S. Breweries per Capita)


Found on SloshSpot.com, a U.S. map showing breweries per capita by state.  Drink up!

Friday, January 30, 2009

The Best Beer in America


Mike Wirth, The Beer Geek, created this map of award winning beers using 20 years of data of the Great American Beer Festival medal winners from 1987-2007. Originally created for the Lyke 2 Drink blog, it also shows the breweries with the most medals and the specific beers with the most awards.

Great work Mike!

UPDATE: Mike has put up an updated version of the Best Beer in America map.

Saturday, November 1, 2008

Wine Flavor Visualization

A great visualization by Carl Tashian on tashian.com that connects different wine types with the flavors and notes of each.
What is the relationship between wine varieties and flavor components? This visualization attempts to show the strength of these relationships. I culled descriptive flavor words from over 5,000 published wine tasting notes written between 1995-2000 in a major Australian wine magazine.
Via Information Aesthetics.

Thursday, October 30, 2008

The Future of Food


Wired magazine has a great series of nine infographics from the November issue about the world's food supply problems.
Forty years ago, advances in fertilizers and pesticides boosted crop yield and fed a growing planet. Today, demand for food fueled by rises in worldwide consumption of meat and protein is again outpacing farmers ability to keep up. It's time for the next Green Revolution.
Thanks for the link Ethel!  Here are a few more.  Check them all out on Wired.com.


Wednesday, August 13, 2008

BBC World Food Prices


The BBC online has a site dedicated to charting food prices around the world called : The cost of food: Facts and figures.  Mostly simple charts, but they've found a handful of really good information.  They could make these prettier, but they get the message across.  Each chart tells a simple story.

Thursday, June 19, 2008

Grocery Aisle Nutritional Values


Three different ways to view the grocery store from Wired Magazine Infoporn January 2008 (16.01) by Dan Marsiglio. Cost per Calorie, Calories by Weight and Sugar by Weight.

If you're trying to cut back on the sugar in your diet, stay away from the cereal aisle!

Tuesday, June 3, 2008

The Infographic that Saved a Million Lives


Great story from 37signals.com about a very simple infographic that motivated Bill and Melinda Gates to change the focus of their charity spending.
“No graphic in human history has saved so many lives in Africa and Asia,” says NY Times columnist Nicholas Kristof about an infographic in a ‘97 Times article that spurred Bill and Melinda Gates to take action on public health.

...But then bill confessed that actually it wasn’t the article itself that had grabbed him so much—it was the graphic. It was just a two column, inside graphic, very simple, listing third world health problems and how many people they kill. but he remembered it after all those years and said that it was the single thing that got him redirected toward public health.

Wednesday, April 2, 2008

Who Owns the Organic Food Companies?


Great chart by Phil Howard from Good Magazine showing which of the large food processing companies own some of the most popular organic food brands. Pepsi owns Naked Juice?

Found on digg.com after I heard about it on the diggnation podcast.

Sunday, January 27, 2008

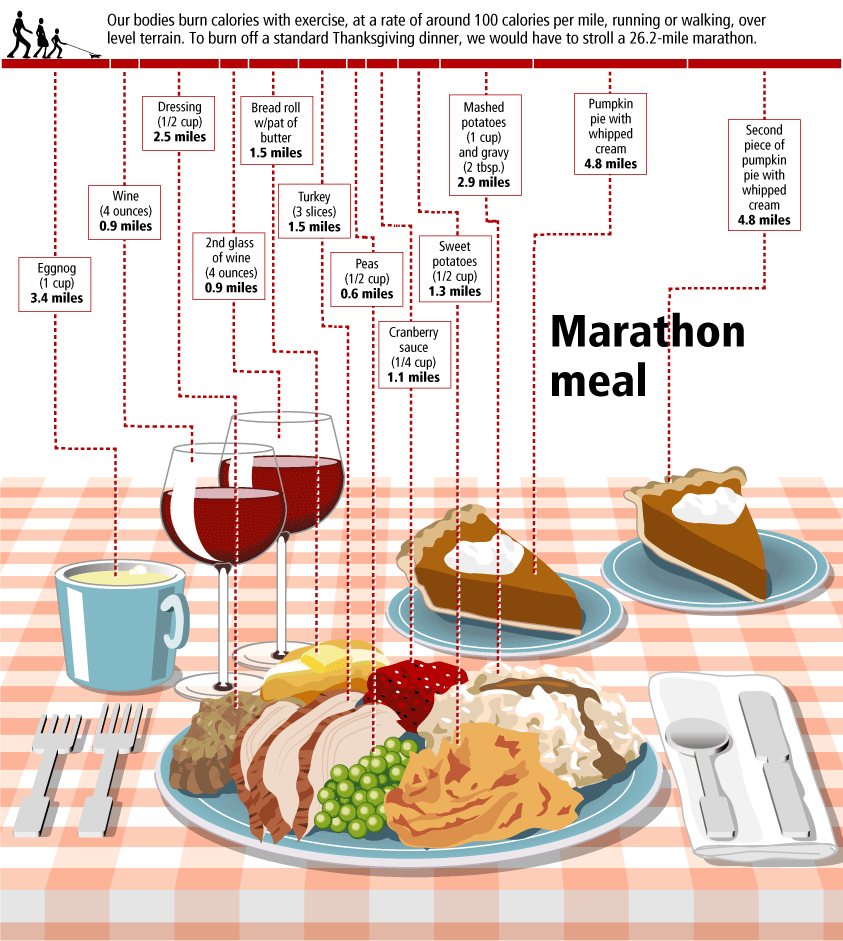
The Marathon Meal


You have to walk 26.2 miles (a complete marathon!) to burn off the calories from a standard Thanksgiving meal, shown here broken down by each dish included. That extra piece of pumpkin pie is worth 5 miles!

This infographic is from Gary Newman Design, who does some fantastic work.

Tuesday, January 22, 2008

Nichloas Felton's 2007 Annual Report


Nicholas Felton has published his new 2007 Annual Report. I love the way he breaks down his own personal life into maps and charts. I had just posted about his 2006 Annual Report last month.

Wednesday, December 26, 2007

Nichloas Felton's Personal Annual Report

Nicholas Felton (www.feltron.com) has created his own personal 2006 Annual Report, looking back at his life during 2006 and using maps, charts, timelines and facts to visually track his activities. With pages dedicated to photos, travel, drinking, reading and food, he plots out his one-year history.

Friday, December 7, 2007

Cooking Infographics


Found on SimpleComplexity.net, Cookz (coo.kz) is a website under development that illustrates recipes with visual infographics. There is an example up now for chocolate chip cookies.

More details are found on flickr, under the user macro girl:
The visual equivalent of a thesis - work from my final semester in Visual Communications.

Friday, September 28, 2007

The Wine Advocate Vintage Guide


From eRobertParker.com, the online Wine Advocate Vintage Guide. Fascinating guide of wines from 1970-2005. Wines are grouped by region and year, and each group is scored and given a letter code to identify the current maturity status of those wines (like Ready to Drink, Too Old and Early Maturing). The color coding represents ranges of the numeric scores.

The guide is interactive, so clicking on any of the rating circles brings you to a list of the specific wines grouped together for that region. For the specific wines, you can see their individual name, score, maturity level and price range.

A PDF version of the guide is available here for download.

Monday, August 13, 2007

World Drinking Map


From drinkingmap.com, this map shows the legal drinking age by country. For the vast majority of the world 18 is the legal age. There are only a few countries like the U.S. that have a drinking age as high as 21.