Showing posts with label corporations. Show all posts

Thursday, December 10, 2009

The Carbon Economy - Infographic Video


New infographic video from Xplane.com.  The Carbon Economy takes a look at the political landscape around climate issues and new, green markets are emerging.
Created with The Economist, the video conveys the state of global climate change and what steps must be taken to reach a positive outcome. The piece was shown at The Economist's recent Carbon Economy Summit in November 2009.
Timed with the publication of a special report in The Economist, The Carbon Economy summit examines how the political environment has changed since Kyoto and how committed regions and industries are to a sustainable carbon strategy.

Tuesday, December 1, 2009

Vote With Your Dollars! - Corporate Political Contributions infographic


Vote With Your Dollars, is a corporate political contributions map.  Using the public data from the Center for Responsive Politics (2004-2008), GoodGuide.com has plotted the balance of contributions from companies.  Mouse-over a specific company logo to see the detailed data (like Dell above).
View the political contributions of your favorite companies and see how you vote with your dollars.  The data is surprising!
You can choose specific companies or business sectors, and then change the sort order.  Here is the retail sector sorted by Most Democratic Leaning:


Thanks Anthony for sending in the link.  Sorry it took so long to get posted.

Wednesday, October 28, 2009

A Graphic History of Newspaper Circulation


From The Awl, this certainly isn't the prettiest infographic I've ever seen (it's basically just a line chart), but it tells it's story to the viewer very well.  Maybe there are times when a simple chart from Excel can do the job...NAH.   From a title that proclaims "A Graphic History of Newspaper Circulation" we certainly expect much more visual information.

I'm sure many of the graphic designers reading this blog could turn this data into a significantly better infographic (hint, hint...).
Every six months, the Audit Bureau of Circulations releases data about newspapers and how many people subscribe to them. And then everyone writes a story about how some newspapers declined some amount over the year previous. Well, that's no way to look at data! It's confusing—and it obscures larger trends. So we've taken chunks of data for the major newspapers, going back to 1990, and graphed it, so you can see what's actually happened to newspaper circulation. (We excluded USA Today, because we don't care about it. If you're in a hotel? You're reading it now. That's nice.)
Some surprising trends: the New York Post has the same circulation it had two decades ago! Also, the once-captivating battle of the New York City tabloids has become completely moot.
Some unsurprising trends: the Los Angeles Times is an absolute horrorshow. Not shown: the Boston Globe disappearing off the bottom of this chart, in a two decade decline from 521,000 in 1990 to 264,105 this year.
Found on Daring Fireball.

Wednesday, October 7, 2009

CEO Compensation Infographic Contest Winner!


In September, GOOD magazine held an infographic contest to illustrate the top CEO compensation packages.  The above infographic by Dee Adams wins the prize!
Dee Adams’s piece “The Top 8 of CEO Compensation” does an excellent job of illustrating the massive salaries of CEOs and relating them to regular employees in a clean and simple manner. It’s our winner, and Adams will take home our prize package, including a GOOD T-shirt, a free subscription, and $250. You’ll be able to see her infographic in print in our next issue as well.
All of the entries are available for viewing here, but I wanted to include a few of my other favorites:


By Robin Richards:


By Jessica Karle:


Monday, July 27, 2009

Amazon Acquisitions infographic


Found on meettheboss.com, a decent infographic of the acquisitions that Amazon.com has made over the years.  Drawn like an org chart, I like that each branch represents another year, so it becomes a timeline.

Monday, June 22, 2009

Market Visual (BETA) knowledge maps


I came across Market Visual Knowledge Maps this morning.  It claims to still be in BETA, and it maps business relationships based on companies or people that you enter.  It seems to build these mind maps on the fly, and saves any maps that you have build so you can retrieve them later.


It's a service you have to pay for, but if you're looking through annual reports and SEC filings to find people and connections, this will save you a bunch of time.  There's a fully interactive sample map, as well as an introductory video.

Tuesday, June 2, 2009

Déjà Poo: The Living Machine Sewage System


I saw that Nathan posted this one over on FlowingData this morning, and I had to share.  This is from a Wired article on howusing the plants in the lobby of an office building can help treat the sewage generated.

Tuesday, March 17, 2009

Bad News for Newspapers


Infographic from the NY Times (I know, ironic isn't it?) that shows the drop in circulation of major newspapers across the U.S.
Heavy debt has dragged several newspaper companies into bankruptcy. The industry’s dwindling revenues have forced some money-losing papers to close, and papers that are for sale are having trouble finding buyers. Experts say that before long, a major American city could be left without a daily paper. (Related Article)
Found on Twitter from @edial

Tuesday, February 3, 2009

Mapping the Growth of Target


Nathan Yau over on FlowingData.com has done a great job creating an animated map showing the growth of Target stores across the U.S.
Well, fortune was smiling on me last week, and I got a hold of data for Target opening dates and locations (thnx, Cole). So here it is - a map that shows the growth of Target from 1962 through 2008.
Nathan has promised to combine the data from this map with his previous work mapping The Growth of WalMart, into one map where you can see the differences.  So we'll keep our eyes out for that.

Tuesday, January 20, 2009

Dramatic Shift in Marketing Reality


Scholz & Friends: "Dramatic shift in marketing reality from Michael Reissinger on Vimeo.

Great little video from Michael Reissinger on the need for innovation and consumer interactions in today's marketing world.

Found through Twitter: @stonepayton

Monday, December 29, 2008

25 Years of Mac: Timeline


From Wired.com.  I like that this History of Apple isn't your traditional timeline.  It does go from left to right, but the images are mixed and overlapping.  It show a clear progression from beige to colors to white to silver.  The style also invites the viewer in to explore the details hidden in the image and find the extra images that specifically tagged with a date across the top.

Saturday, November 29, 2008

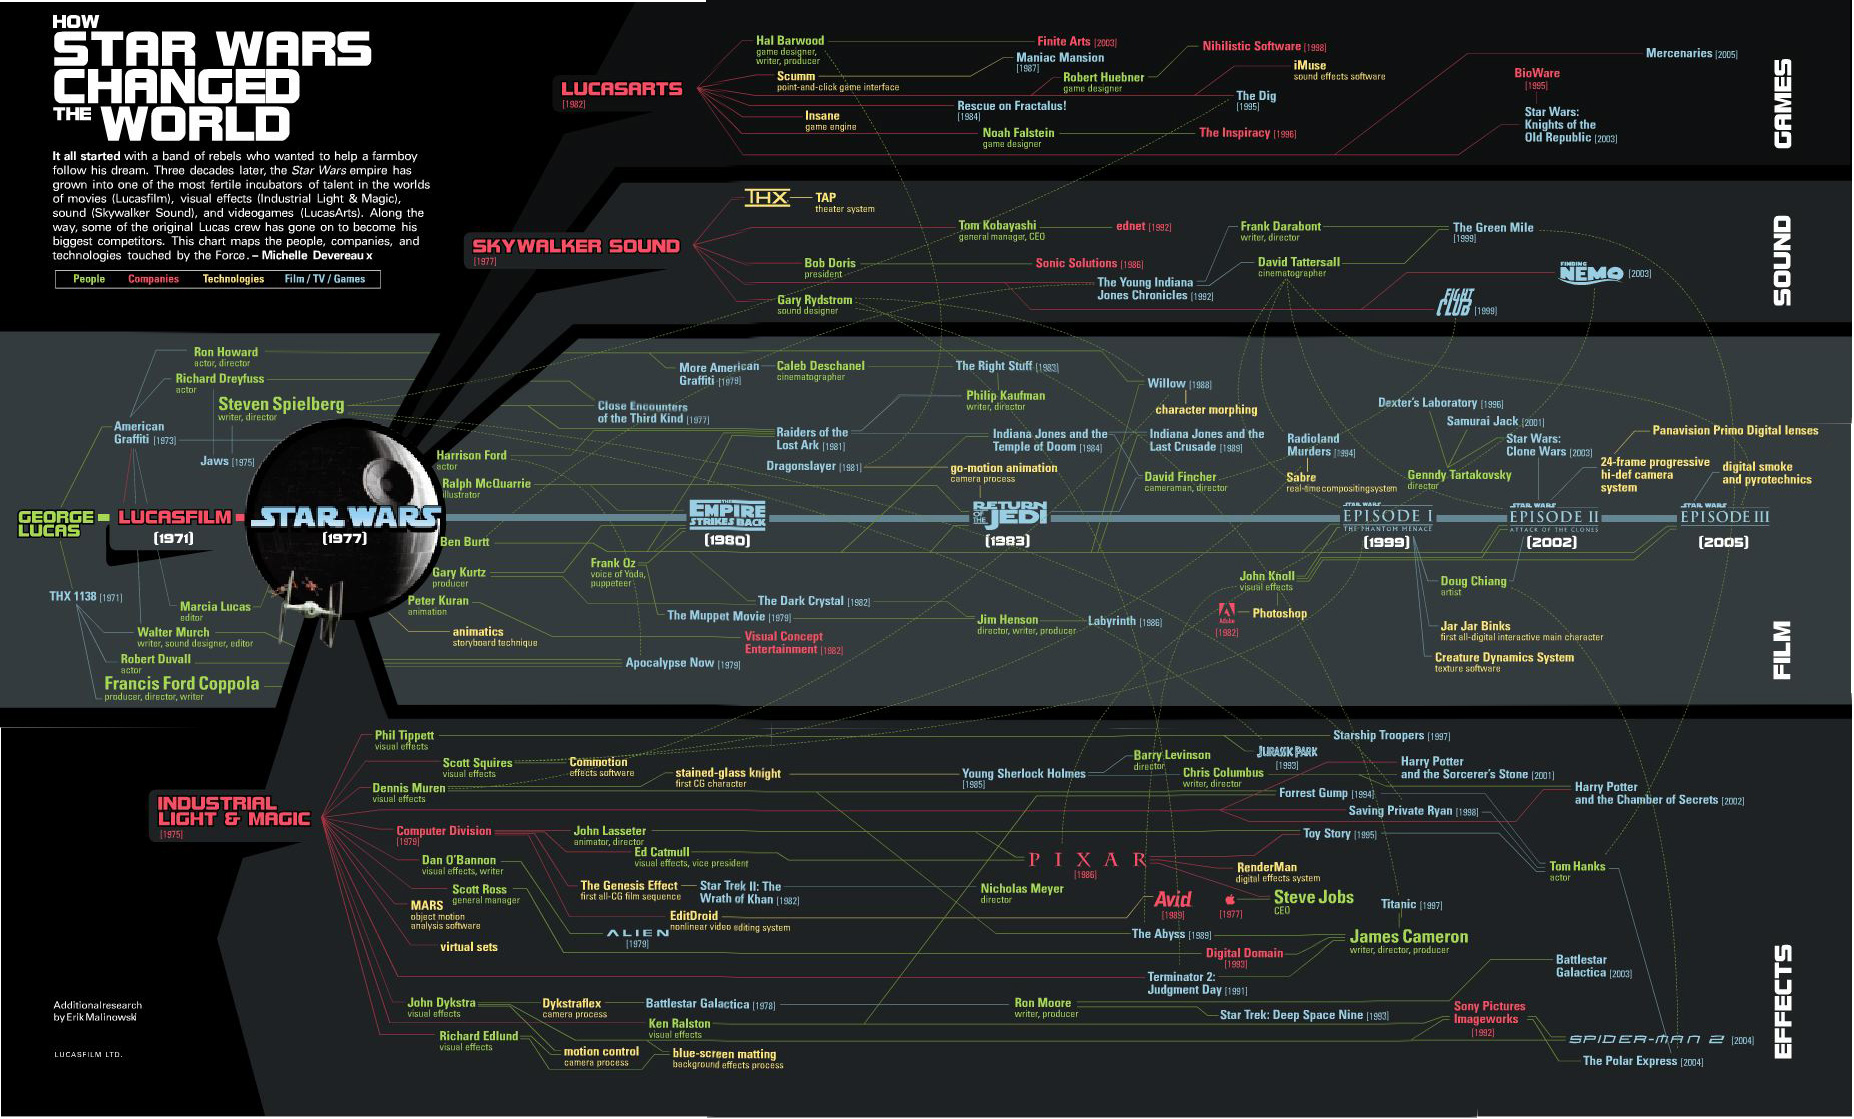
How Star Wars Changed the World


The original Star Wars has certainly gone on to produce more than just sequels.  It has created the people and the technologies that are now considered the best in the industry.  Michelle Devereaux created this family tree for Wired magazine back in 2005 and I love how the line colors indicate people, technologies and company connections, but the tree is organized into movies, sound, effects and technologies.

I actually believe the tree is incomplete.  I think Star Wars had far greater reach and influence that what Michelle mapped out here.
It all started with a band of rebels who wanted to help a farmboy follow his dream.  Three decades later, the Star Wars empire has grown into one of the most fertile incubators of talent in the worlds of movies (Lucasfilm), visual effects (Industrial Light & Magic), sound (Skywalker Sound), and videogames (LucasArts).  Along the way, some of the original Lucas crew has gone on to become his biggest competitors.  This chart maps the people, companies and technologies touched by the Force. - Michelle Devereaux
Thanks Alwyn!

Thursday, October 16, 2008

Brand Tags


BrandTags.net is a project by Noah Brier that gathers user input to create tag clouds for many of the biggest brands in our culture.  You can add your own input into the project on the main page, or browse brand results.  The example above is for Velveeta.

Friday, October 10, 2008

Savings Mis-Trust video


Our friends over at XPLANE have done a fabulous video explaining what led up to the recent credit crisis in the U.S. economy.  A great job simplifying a complex problem.

Thanks Parker, and great job to your team!

Tuesday, September 30, 2008

A Year of Heavy Loses


Over at Nytimes.com, they have a good treemap showing the drop in market capitalization over the past year of most of the big financial firms on Wall Street.  It's a little bit interactive, in that when you hover your mouse over any box, you will see more details.

Found on infosthetics.com

Monday, September 22, 2008

Probabilistic Stock Market Forecast


I won't claim to understand or attempt to explain the math behind the investolution.com charts that predict the overall stock market for the next 40 days.
This page contains the prediction for S&P 500 Index minimum and maximum daily closing prices over the next 40 trading days.  

It is predicted that S&P 500 Index will not close under 1,178 and over 1,295 between the dates September 19, 2008 and November 14, 2008. This prediction method was accurate for 71.0% and 95.0% of the cases (for minimum and maximum predictions, respectively) within an error margin of +-5% in the past. 

Thanks Andrew for sending in the link.

Monday, August 4, 2008

The Art of Visual Thinking


Last week, Guy Kawasaki posted a good interview with Dan Roam on his blog.

Do you recognize this picture? It's how Southwest Airlines was pitched.
To provide more insight into the process of visual thinking, I tapped Dan Roam. He is the author of The Back of the Napkin: Solving Problems and Selling Ideas with Pictures . In this interview he explains why and how to use visual thinking in your business. Click here to read it. To learn even more about visual thinking, be sure to read his book.

Monday, July 21, 2008

When are you at risk online?


From the Mozilla website, and obviously a part of their sales pitch.  I picked up that the calendar arrangement of the squares is in fact correct for 2006.  Its getting the small things right that help make good infographics.

An independent study shows that, in 2006, IE users were vulnerable to online threats 78% of the time. Firefox users? Only 2%.


“At risk” defined as publicly available exploits with no patch. Source: “Internet Explorer users Unsafe for 284 Days in 2006” Brian Krebs, Washington Post, 1/4/2007

Wednesday, July 16, 2008

iPhone 3G under the hood


Will all of the hype around the launch of the iPhone 3G, I wanted to share a simple infographic showing the circuitboard from inside one of the new phones.  It clearly identifies each major component and also adds what that compnent does inside the phone.  The graphic really adds a significant amount of depth to the article.


The full article is from TechOnline.

Monday, July 7, 2008

The iPhone Timeline


From iPhoneGold.org, is a cool little iPhone timeline.  I couldn't find an author to credit, just the website.


Found on digg.com