Showing posts with label humor. Show all posts

Tuesday, December 29, 2009

Visualizing Gravity Wells - infographic comic


Another great new infographic comic from xkcd.com.  A mix of real science and humor, this one plays on the words "gravity well" by visualizing the strength of each planets gravity as the depth of a crater scaled to Earth's surface gravity.
The chart shows the "depth" of various solar system gravity wells.
Each well is scaled such that rising out of a physical well of that depth - in constant Earth surface gravity - would take the same energy as escaping that planet's gravity in reality.
Click on the image to go to the xkcd.com site to see the high-resolution version.


Thanks for sending in the link Ruben!

Tuesday, December 22, 2009

Holiday Cliché Find-It Graphic from Xplane.com


Check out this fun Holiday Cliché Find-It graphic from Xplane.com!  It's available as a 11x17" sized PDF so you can view or print it out.

“Get your ducks in a row” so that you aren't “caught with your pants down” this holiday season! After all, it can be like “herding cats” out there this time of year, and you definitely don't want to get stuck “in the weeds.” So, go ahead and take a minute to “shop this around,” “see if it sticks” and celebrate from a “10,000-foot view.” It's all “blue sky” from here on out, nothing but a “win-win situation!”
Think you know your business clichés? Find where they're hiding in this holiday XPLANATiON™ created by your friends at XPLANE! Just click the image above to download the tabloid-sized 11x17" PDF.
Thanks to Parker at Xplane.com

Thursday, December 17, 2009

The Simpsons 20th: Comedy [Family] Tree


The Simpsons celebrate their 20th anniversary this week on Thursday, and CNN Entertainment published this chart "The Simpsons Comedy Tree" on Monday.  A combination Nightingale Rose Graph (also called a polar area diagram), family tree and timeline, this simple chart connects the influences that impacted Matt Groening and the creators of the Simpsons as well as the shows that came after.
"The Simpsons" stands on the comedic shoulders of many that came before -- and has influenced countless works that have arrived since. Here are just a few of the roots of the "Simpsons" comedy tree and the branches of those it gave life to. (The following, illustrated by the doughnut at the top of the story, is by no means complete, and each member has its own, sometimes overlapping influences.) 
Thanks to Tony Hendra's "Going Too Far" for inspiration and cartoonist Art Spiegelman for having his fingerprints all over the place.
The article also includes descriptions of the actual influence for each of these shows.

Thanks for the link Matt!


Also:


For those Simpsons fans of you, here is also the poster created exclusively for Entertainment Weekly celebrating the release of the 20th season DVD set on Jan 12.  Dude, make sure to go look at the large, scrollable version.

Wednesday, November 4, 2009

XKCD: Movie Narrative Charts


Great post by the XKCD online comic series!  They occasionally post a infographic-style piece, and this one doesn't disappoint.

Created by Randall Munroe at XKCD, the Movie Narrative Charts plot the interactions between key characters on a timeline, grouping the character lines together when they are interacting in the movies.  He obviously spent some time working on these, and be sure to check out the detail in the full size version.


The last two are jokes, but the ones for Lord of the Rings, the original Star Wars Trilogy and Jurassic Park are real and very well done.  I love the Primer chart poke at trying to follow the movie!  Not as mainstream as the other movies, but it's definitely appropriate.  I'd love to see how Randall would chart Memento!

Thanks Tom for the email link!  Popular on the blogs, this was also found on Infothetics, FlowingData, SimpleComplexity, VizWorld and Fast Company.

Friday, October 30, 2009

What's a Gruzzle?


So, what's a Gruzzle?  With extensive use of Venn Diagrams, GL Hoffman often posts these visual blog posts on his blog, What Would Dad Say, and Fast Company has also started pubishing them as well.


So back to the original question, What's a Gruzzle?  Here's a really good answer, by one of his readers:


But here's the official answer:


You can also follow @GLHoffman on Twitter

Monday, October 26, 2009

Procrastination: The Infographic Video


Although I really like this video by Johnny Kelly at Design You Trust (Good-Okay-Brilliant-Great job Johnny!), I not convinced this is infographics.

What do you think?  Is this infographics or illustration?

Found on The MLxperience

Friday, October 9, 2009

Information vs. Confusion chart


Love it!

From Jessica Hagy on Indexed.

Wednesday, September 9, 2009

Balance Your Media Diet (The Media Pyramid Infographic)


From Wired Magazine's "New Rules for Highly Evolved Humans" section of the August 2009 issue.
Practicing good nutrition keeps your mind sharp, your body fit, and your life long. The same could be said for consuming media. (Seriously, knowledge is power.) When you add it all up, the average American spends roughly nine hours a day glued to some kind of screen, and like your diet, quality is as important as quantity. Here areWired's suggested servings for optimal media health.
Found on Nathan's Flowingdata.com

Monday, August 10, 2009

What is Your Wine Personality?


From the Texas Department of Agriculture at GoTexanWine.org, the Wine Personality Wheel comes from the Texas in a Bottle guide to Texas Wine (download as a pdf).  I love the sense of humor.
Ever listen to somebody describe a wine?  They talk about it having "character" and "personality."  To hear them tell it, wines are a lot like people.  We've talked it over and came to a conclusion - they have it backwards.  People are a lot like wines.
Here at the Viticultural Personality Institute, we've compiled a fun list of personality types based on wine preferences.
If your favorite wine listed here does not accurately reflect your particular personality, please choose another favorite wine (or change your personality - otherwise, you'll make our researchers look bad).

Looking around the GoTexanWine.org site, I also found a good, animated timeline (link) of the history of wine in Texas.


Eight federally approved Viticultural Areas currently exist in Texas. Eighty-five percent of wine from a Viticultural Area must be made from grapes grown within the area's boundaries. If the wine is a varietal, 75 percent of that wine must be made from the designated grape variety.

Thursday, March 26, 2009

Infographic Little Red Riding Hood video


Slagsmålsklubben - Sponsored by destiny from Tomas Nilsson on Vimeo.

I loved this!  Inspired by the Royksopp music video "Remind Me", Thomas Nilsson has created a fantastic infographic video retelling of the Little Red Riding Hood fairy Tale.

Great job Thomas!

Tuesday, March 24, 2009

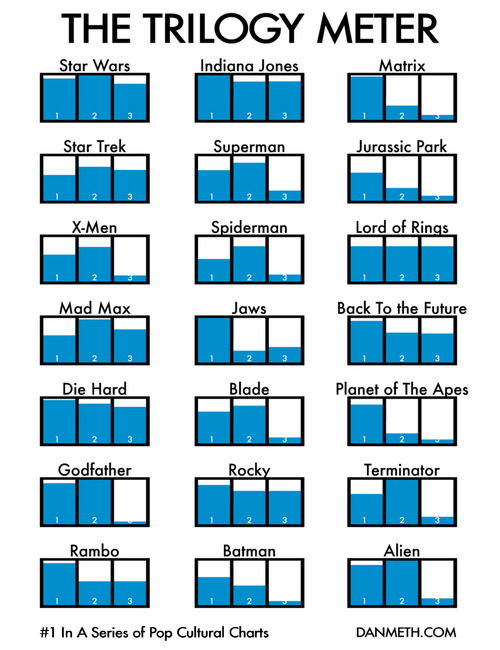
The Trilogy Meter


Dan Meth did a great job creating his own personal Trilogy Meter showing his personal enjoyment of movies released as a trilogy.  This shows that Dan never likes the 3rd movie as much, so he should just stop spending the money.

Although this is based on Dan's personal ratings for each movie, there's no reason why something like this couldn't be done with more official data like critic ratings or box office dollars.

Thanks for the link Jesper and Daniel!

Monday, November 3, 2008

Where your Apple Tax goes...


A little humor Monday morning from the brilliant minds behind The Joy of Tech.  Click the link to see the full version.

Saturday, September 20, 2008

Points Of View


This is a new t-shirt from Despair.com.  If you're not familiar with Despair, they are the opposite of Successories, the company that produces motivational posters.  I'm a big fan of their humor, and I loved the new shirt design.

Thursday, September 11, 2008

Laugh System Diagram


I'm back!  I've been on vacation to Walt Disney World in Florida, but I'm back now and its time to catch up on a bunch of great infographics that have been sent in to me.

First, I'll share this one from Disney.  The Laugh System Diagram is from the queue area in the Monsters, Inc. Laugh Floor.  I wish they sold it as a poster.  It seems simple, but I was amazed watching a five year-old explain it in great detail to her parents.

Of course, there are some inside connections too.  The yellow car in the bottom right corner is the car from the animated short on the DVD "Mike's New Car".

Thursday, July 31, 2008

Anatomy of a Balloon Animal


Now here's an odd poster by Jason Freeny depicting the internal anatomy of balloon animals.  Check it out along with his other works at Moist Productions.  I especially liked that he included visual instructions on how to create the balloon animal at the bottom.


Thank Torquil for sending in the link!

Wednesday, June 25, 2008

The Summer of Pool Shows


Another page of quirky charts from Andrew Kuo that I came across from October 2007. These try to represent information about the 2007 summer's series of concerts at Brooklyn's McCarren pool.

Found on CoolHunting.com

Tuesday, June 24, 2008

Pessimist's Guide to Summer Festivals

A full page of different chart styles by Andrew Kuo on nytimes.com. A number of Andrew's quirky charts have been showing up in the NY Times lately.
When he was 15, in 1992, the artist Andrew Kuo tagged along with his older brother to the second year of Lollapalooza in Stanhope, N.J. It was Mr. Kuo’s first summer festival, and he was so excited that he bought the albums by most of the bands on the bill beforehand. Then, halfway through the show, after sets from Pearl Jam (his favorite) and the Jesus and Mary Chain, “I didn’t want to be there anymore,” he said. “I felt like I was being held captive.” Thus began his lifelong ambivalence toward outdoor festivals. “When you finally get to the picnic, there’s ants everywhere,” Mr. Kuo said. Here’s a pessimist’s guide to the summer festival season, which kicks into high gear with the Bonnaroo Music and Arts Festival on Thursday in Manchester, Tenn. Mr. Kuo will be home napping.
Thanks Sandhya!

Wednesday, June 18, 2008

Car HUD from the future


From the January 2008 (16.01)Wired Magazine; Artifacts from the Future, by Chris Baker. This future automobile HUD has some really cool features like a DUI driver identified ahead, in-car video chat, live GPS map with directions and a coupon for the Starbucks at the next exit. He's doing 90MPH, eating an energy bar and he's in the slow lane! For California, there definitely aren't enough cars on the road!

Looks a lot like a bunch of widgets on the desktop of your PC. It definitely seems too cluttered, but I think it was necessary to fit it on a narrow magazine page. I love that it seems to use a multiple-blink interface. Check out the calendar appointment in the top left: "...blink 3 times to reschedule."

If only this future were closer. I'm a real fan of car HUD interfaces. It's one of those promised technologies that still haven't become reality.

Friday, June 13, 2008

The Extinction Timeline 1950-2050


Richard Dawson from What's Next (www.nowandnext.com) created the Extinction Timeline with his predictions of what products and services will disappear in the next 50 years. Also available as a PDF here. Here are a few highlights:
  • 2018 DVDs
  • 2019 Libraries
  • 2025 Desktop computers
  • 2030 Reality TV (why so long?!?)
  • 2037 Glaciers
  • 2049 Physical Newspapers
Found on Digg.com

Thursday, May 15, 2008

Airport infographic video

Cool infographic video: airport by iain anderson (as shown in oz digital shorts in the sydney film festival 2005)

Found on funwithstuff.com