Showing posts with label photo. Show all posts

Monday, September 28, 2009

Running The Numbers, New Book from Chris Jordan!


After finding the video last week, I also found that Chris Jordan has published a book of his work called "Running The Numbers".  I couldn't help myself, I had to buy a copy.  It's available on Amazon.com and directly from Chris Jordan's site.

Chris Jordan's photography is focused on visualizing the huge numbers and statistics from life in America.  His photos put the large quantities into a visual scale that our brains can understand.

Here's a link that will help support Cool Infographics too.

Thursday, September 24, 2009

Chris Jordan's TEDTalk 2008 - Visualizing Our World [video]


I've posted some of Chris Jordan's images here before, but here is a video of him talking about his work at TED in February 2008.
Artist Chris Jordan shows us an arresting view of what Western culture looks like. His supersized images picture some almost unimaginable statistics -- like the astonishing number of paper cups we use every single day.
Chris Jordan runs the numbers on modern American life -- making large-format, long-zoom artwork from the most mindblowing data about our stuff.
Thanks to Ben Fry for posting this on his site.

Here's a glimpse of Chris Jordan's current project in-progress on the island of Midway Atoll (http://www.midwayjourney.com/).

Friday, July 31, 2009

Roomba path long exposure photo


Paul Mathew at SignalTheorist.com attached an LED to the top of his Roobma and took a long exposure photograph to document the path the Roomba takes.  iRobot can tell you the Roomba gets into every corner, but it takes a visual like this to really prove it.
"Now here’s something interesting, I set up a photo camera in my room, turned out all the lights and took a long-exposure shot of my roomba doing it’s thing for about 30 minutes. The result is a picture that shows the path of the roomba through it’s cleaning cycle, it looks like a flight map or something. It really hits every spot!"
Thanks to Tyler at RoboticVacParts.com for the link!

Monday, June 1, 2009

You Need to Get Seadragon!


If you haven't checked it out yet, you need to take a look at Seadragon.  I know its from Microsoft, but I like it anyway!  Seadragon is a software project to allow users to browse and zoom into high-resolution images.  I'm especially attached to the iPhone version of Seadragon Mobile (link opens iTunes) available for free from iTunes!

One of the best things about the iPhone version is that it includes some example images, and includes some of the work from Chris Jordan.  Longtime readers of the blog know I really like Chris Jordan's series "Running the Numbers" which uses high-resolution images to visually show the viewer statistical information about how we live.

Wednesday, May 20, 2009

Cape Hatteras Lighthouse: The Move of the Millenium


Found on MagaMaps.com, I like the multiple elements included in this infographic.  Plus, I remember this lighthouse, and I can't believe they actually moved it!

Friday, December 26, 2008

Anamorphic Parking Garage Signage


These are images from the Eureka Tower in Melbourne, Australia.  Emery Studio (look at the "Placemaking" link) had the opportunity to use both the horizontal and vertical surfaces to design some anamorphic signage in the parking deck.  When viewed from the correct direction as you're driving, the words appear legible and lead you in the correct direction.  Viewed from another angle, the words appear as abstract lines and colors.


Thanks Ethyl for sending the link on Twitter!  Images are from the Kosmograd blog.

Wednesday, December 10, 2008

10,000+ iPhone Apps Mosaic


To help Apple celebrate 10,000 iPhone apps in the iTunes App Store, TapTapTap created this iPhone mosaic using icons from the available apps.

Check out the TapTapTap blog.

Here is the high-resolution image.

World of Apple is offering the image as a poster for $50

Thursday, September 11, 2008

Laugh System Diagram


I'm back!  I've been on vacation to Walt Disney World in Florida, but I'm back now and its time to catch up on a bunch of great infographics that have been sent in to me.

First, I'll share this one from Disney.  The Laugh System Diagram is from the queue area in the Monsters, Inc. Laugh Floor.  I wish they sold it as a poster.  It seems simple, but I was amazed watching a five year-old explain it in great detail to her parents.

Of course, there are some inside connections too.  The yellow car in the bottom right corner is the car from the animated short on the DVD "Mike's New Car".

Thursday, August 21, 2008

Olympic Maps of Beijing


Let's not forget the Maps!  NYTimes.com has a number of interactive maps of the Beijing area showing the event locations, new architecture built for the Olympics, the demolition and expansion of the old city over the last 10 years, the new subway routes and some of the routes for the marathon and cycling events.

Friday, June 6, 2008

The Flickr User Model


Designed by Soldier Ant (his real name is Bryce Glass), the Flickr User Model attempts to map out the Flickr user experience. This is version 0.1, and I think he's working on version 0.3 now. Also linked on visualcomplexity.com
On his post on October 24, 2005, Bryce explains: "I've been doing some concept diagramming for work lately, and I've found myself enjoying it immensely. (...) However, since it's for work I can't share much of it. I did post some sanitized versions, with all the object-names obsfucated, but that just didn't seem wholly satisfying. So over the weekend I invested some time in a diagram that I can share with the internets: a simple Flickr user model (regrettably incomplete -- but I realized that if I tried to include the whole Flickr-verse that this diagram would go beyond labor of love and straight into excercise in folly)".
Thanks Rex for sending in the link!

Tuesday, March 11, 2008

Steve Jobs photo mosaic from Apple products


This one is just fun. Steve Jobs portrait photo mosaic made from Apple products and icons from OS X. Another version of this from the same artist was used in the March 17, 2008 issue of Fortune magazine.

Found on digg.com

Monday, March 3, 2008

The Calculators of HP poster


From the The Hewlett Packard Calculator Page.
This poster shows every HP calculator made starting with the famous HP-35. Each calculator is displayed with it's production start and end data, and it's project codename.
It's amazing how many of these I have actually used. This is similar to the Evolution of Apple Design...but with more buttons.

Monday, February 18, 2008

GE Ecomagination Blueprint Ads

GE is running The Blueprint Series of five print ads combining photos with an overlay of infographics. This works really nicely because they kept the infographics relatively simple.


Found on notcot.com.

Thursday, January 10, 2008

Digg These Pics


Really cool new feature over on Digg.com. Back in late 2007, they added an Images category so users could digg their favorite pictures. Now they've added an interactive image viewer in the Digg Labs that lets you see new images and pictures being dugg in real-time.

The only thing I don't like is that it doesn't let you add any search terms. You have to see all of the activity, and can't narrow it down it all.

Wednesday, January 2, 2008

Savvygraph your Amazon product searches


I can't tell if Savvygraph.com is part of Amazon.com, or if this is a separate company running this. It takes any Amazon.com search terms you enter and charts the results on an X-Y chart showing the Average Rating and the total Number of Ratings.

It's fairly interactive. You can limit the price range using the sliders at the top, and when you hover over any of the pins you get the product image. Clicking on the pin takes you to that item on Amazon.com. Clicking on any of the links on the right limit the search to a smaller subset based on your choice (like a particular brand).

EDIT: I did receive an email from the author who confirmed that the site is totally separate from Amazon.com. Thanks Dave.

Tuesday, January 1, 2008

Smoking Kills 200,000 Every 6 Months


Skull With Cigarette, 2007 [based on a painting by Van Gogh]
72x98"

Depicts 200,000 packs of cigarettes, equal to the number of Americans who die from cigarette smoking every six months.

I've become a big fan of Chris Jordan's work, especially the Running The Numbers series. I just noticed that he has added to the collection on his website with some new pieces! A friend of mine quit smoking this week, so in her honor I want to share one of the new artwork pieces.

Wednesday, December 26, 2007

Nichloas Felton's Personal Annual Report

Nicholas Felton (www.feltron.com) has created his own personal 2006 Annual Report, looking back at his life during 2006 and using maps, charts, timelines and facts to visually track his activities. With pages dedicated to photos, travel, drinking, reading and food, he plots out his one-year history.

Thursday, October 18, 2007

Plastic Bags


Here's another one from Chris Jordan. Is it art, or is it infographic?

The image shows 60,000 plastic bags, which is how many bags are used in the U.S. every 5 seconds! The picture currently on display at the Paul Kopeikin Gallery in Los Angeles is 5ft x 6ft large so viewers can step up close to see all of the details.

Thursday, September 27, 2007

Shanghai Urban Planning


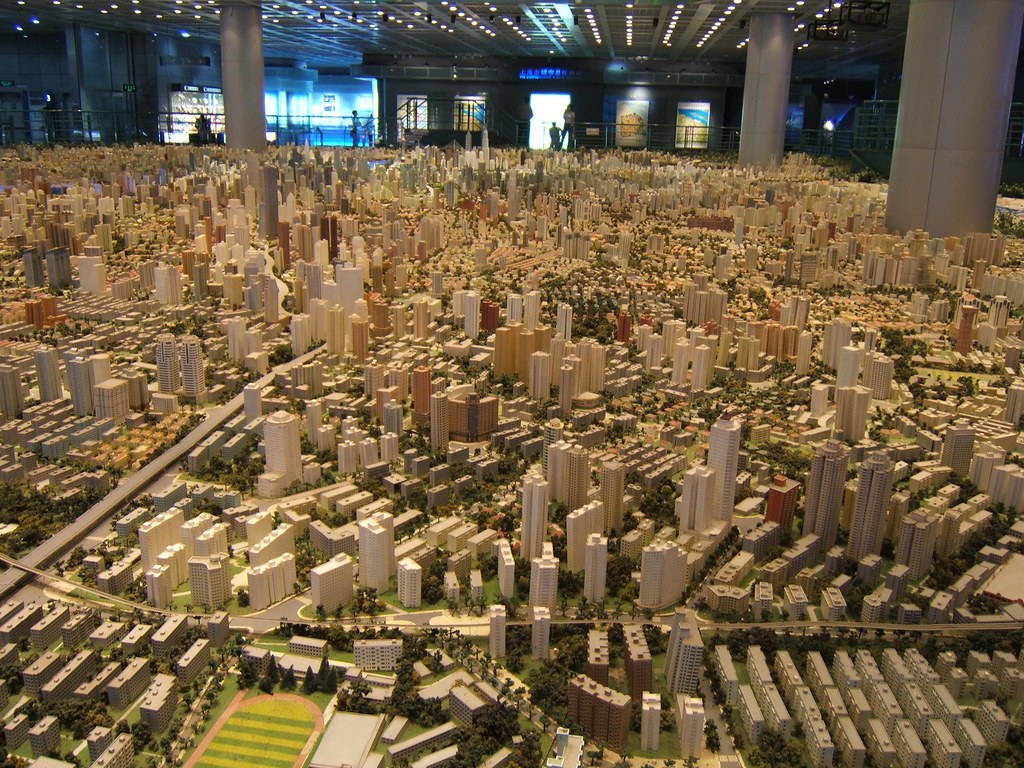
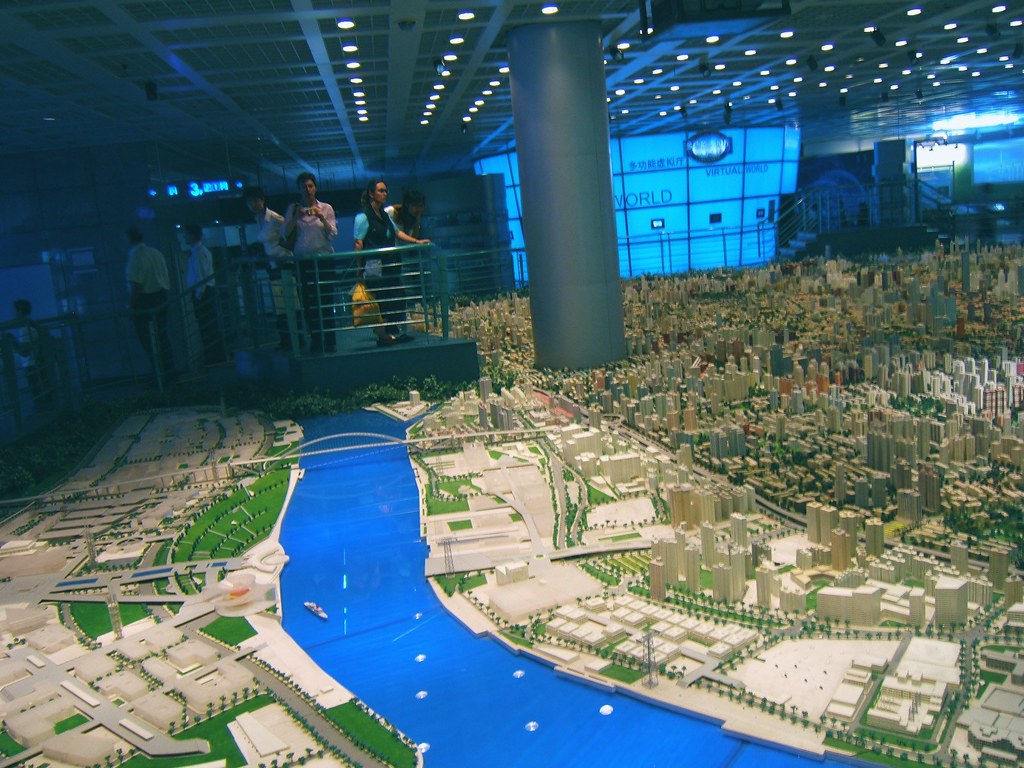
Last year I was in Shanghai, China on business. A friend suggested we visit the Shanghai Urban Planning building, and the first thing I thought was "ohhh, I bet that's exciting...not". But, he convinced us to give it a try, and here are a few photos I took.

On the top floor of this building is the largest model of urban planning in the world. For an American, seeing Shanghai is a shock at how large the city is, and how many skyscrapers there are. For reference, Shanghai's population is about 22 million people, compared to about 8 million in New York. Most U.S. cities have a "downtown" type area where the most skyscrapers are clustered, but Shanghai is a city of skyscrapers everywhere.

The World Population Map is one way to understand the scale difference between the U.S. and China, but this model city is astounding. Even better than riding around town (you definitely don't want to be the one driving), the model city really drives home the scale of Shanghai, and what has been accomplished in urban development. The model is built at 1:2000 scale.


Those are the building support columns in the middle of the model, NOT some new super skyscraper!

Saturday, September 22, 2007

Earth At Night


This satellite photo from NASA spans a 24-hour period showing the entire surface of the Earth in darkness. The lights obviously show the highest areas of concentration of civilization.
Note the Nile River delta, the Siberian Express railway route, the Australian coastal cities, and Africa, literally "the dark continent".
From Princeton's International Networks Archive, the old project of Jonathan Harris.