Saturday, December 29, 2007

How to Spot a Cylon


This poster for fans of the new Battlestar Galactica is for sale over at QMx for $19.95, so there isn't a high resolution file available. Although, I would propose an image that we could read better would help sell more posters. In the spirit of airline emergency procedure cards, 10 ways to identify a Cylon among us.

Be Aware. Be Vigilant.

EDIT: I noticed this is now available at Amazon too:

Thursday, December 27, 2007

The Transatlantic Superhighway


I never really thought about it, but I'm sure the flight patterns over the Atlantic are actually this tightly controlled. Now the news that President Bush made some of the military flight paths available over the holidays makes more sense. The Transatlantic Superhighway is one of the diagrams on John Grimwade's Information Graphics site.

Wednesday, December 26, 2007

Nichloas Felton's Personal Annual Report

Nicholas Felton (www.feltron.com) has created his own personal 2006 Annual Report, looking back at his life during 2006 and using maps, charts, timelines and facts to visually track his activities. With pages dedicated to photos, travel, drinking, reading and food, he plots out his one-year history.

Sunday, December 23, 2007

Miraculous Logistics Behind Operation Christmas


Holiday Infoporn from Wired.com.
Here's our theory: There is, in fact, a nonsupernatural Santa. It's a transnational corporation with one mission-critical fulfillment goal: Every kid who celebrates the holiday gets a toy on Christmas eve.
Check out the side-scrolling timeline at the bottom. I think they should have included Chinese New Year.

Saturday, December 22, 2007

The Disney Cruise Line Cut-Away


The family took our first Disney Cruise this year, which was fantastic! Here's a great cut-away graphic of the Disney Wonder, but the other ship, the Disney Magic is almost identical. This graphic is a little out of date, because some things have changed. The ESPN Skybox is now a teen area called The Stack or Aloft depending on which ship you're on.

The ship is actually quite large, so the spacial representation of locations is really helpful. You can get turned around very easily.

Friday, December 21, 2007

FREE Infographic Holiday Cards!


This is one of the example infographics from Funnel, Inc. I got a postcard from them offering infographic holiday cards, FREE while supplies last. You won't find the link on their website, but the direct URL is http://www.funnelinc.com/holiday. Order yours quick!

By the way, the example infographic above is "How Books are Made" and shows the entire process to print books at Webcrafters, Inc. in Madison, WI.

Wednesday, December 19, 2007

Apple's Life Line


From aaplinvestors.net, more than a simple line chart of sales, its a timeline that highlights major events so you can easily visualize their impact. Even though its simple, I use this type of timeline all the time.

Tuesday, December 18, 2007

Reasons to go to VizThink 2008


In the spirit of practicing what you preach, the team for the VizThink 2008 conference has created a visual guide to "Why come to VizThink 2008?". This graphic definitely has the feel of XPlane. David, did you guys create this one for the conference?

It's coming up soon! Jan 28-29 in San Francisco, CA. (VizThink link)

Saturday, December 15, 2007

Santa Claus vs. Krampus


Infographic for the holiday season. This one definitely made me laugh. Back in the Middle Ages, St. Nicholas had a sidekick named Krampus who took care of the naughty children. Over the years as St. Nicholas evolved into today's Santa Claus, and left Krampus behind. Krampus didn't exactly fit into the Coca-Cola image of Santa Clause that we all know and love today.

Found on tevis.net. I would give credit directly to the authors, but I can't make out their names in the bottom right corner.

Thursday, December 13, 2007

The Chicago Tribune Website


From VisualComplexity.com, here's a project that mapped out the Chicago Tribune Website using a Radial Grouping method. It was created by Graham J. Wills at Bell Laboratories, but it looks like the link to the original graphic is down.

Wednesday, December 12, 2007

NodeTrix: A Hybrid Visualization of Social Networks


NodeTrix was a study of social networks by Nathalie Henry, Jean-Daniel Fekete, and Michael J. McGuffin from France and Canada. Natalie presented their results at the InfoVis conference in Sacramento, CA in November.

Friday, December 7, 2007

Cooking Infographics


Found on SimpleComplexity.net, Cookz (coo.kz) is a website under development that illustrates recipes with visual infographics. There is an example up now for chocolate chip cookies.

More details are found on flickr, under the user macro girl:
The visual equivalent of a thesis - work from my final semester in Visual Communications.

Tuesday, December 4, 2007

Apple's Tipping Point: Macs For The Masses


From Paul Nixon on nixlog.com. In 2005, Apple finally released products from both the Mac line and the iPod line that reached the masses. This created the Tipping Point Effect that has rocketed Apple products and stock in the last two years. Rock on!
The Sweet Spot. Until January 2005, Apple had no iPod or PC products that served the mass market. With the launch of iPod Shuffle and Mac mini they have finally converged two product paths with the mass market in mind. This will not only drive more iPod sales (via the Shuffle), but also fulfill the promised "halo" effect of the iPod products as PC users jump to the Mac mini.
Thanks to Karen for the submission

Monday, December 3, 2007

Infographic Airport Video


I came across this on Janine Swainston's blog:
The animated story of one man's epic journey, created entirely from public domain symbols. In other words, an airport story told in the language of airport infographics.

Sunday, December 2, 2007

Disneyland Wait Time


Traveling in California this last week kept me from being able to post. But here's a real-life infographic from Disneyland in Anaheim, CA. At the entrance to each separate attraction, is a posted wait time estimate, but they are all combined on this information board in the center of the park.

Not willing to wait an hour for the new Finding Nemo Submarine Voyage? Pick a handful of other rides that you can get through in the same amount of time and maximize the money you spent getting into the park.

Saturday, November 24, 2007

Visualizing the Aging Process


Created by John D. Furber at Legendary Pharmaceuticals, this is a visual representation of the biology behind aging using a network diagram. A large format image is available for printing here.

From VisualComplexity:
John D. Furber of Legendary Pharmaceuticals has put together a visual model of aging referred to as 'The 2007 Network of Biological Interactions in Human Aging' that shows the interactions between various subcellular, cellular, extracellular matrix and organ system. This is a great representation of aging as it demonstrates no root cause but rather a network of problem areas that are interlinked. The goal of systems biology would be to flush this out in great detail allowing one to zoom in down to the specific genomic and proteomic components of aging. Systems biology would also pursue such a model to have a functional runtime component to it such that variables could be tweaked and changes introduced to predict impact elsewhere in the various biological networks.

Thursday, November 22, 2007

Timeline of Space Exploration


Newsweek has a cool interactive timeline showing all of the 150+ missions sent into space. Its organized by year (of course) but also by object of destination (planet/moon/asteroid). You can click on a year and zoom in to see specific dates of each launch. Rolling your mouse over any dot gives you the name and details of the mission.

Found on Information Aesthetics.

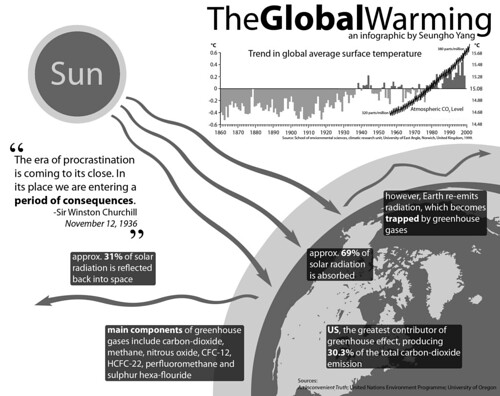
TheGlobalWarming Infographic


TheGlobalWarming Infographic, originally uploaded by Seungho.

Found on Flickr by Seungho.

Saturday, November 17, 2007

Who has the Oil?


I caught this on Digg, it's a map from civicactions.com. There's some good debate in the comments on Digg about the accuracy of the map.

The size of the country represents the relative amount of oil reserves in each country, and teh color of the country represents how much oil is consumed by that country.

Wednesday, November 14, 2007

See My Voice


From the University of Sydney, Bachelor of Design Computing website, See My Voice was a project by one of the students in the program, Andrea Lau.
SeeMyVoice - Social Information/Data Visualisation (or infovis). SeeMyVoice visualises chat transcripts stored by MSN Messenger. It aims to highlight people's style of chatting and increase understanding of our online social interaction. Each person is represented by a coloured wave which ebbs and fluctuates according to message length and the time taken between messages.
Great job Andrea! That's exactly how IM conversations go.

UPDATE: Andrea has a complete website describing her work and the See My Voice project in much more detail.

Monday, November 12, 2007

Grokker


It's not new, but Grokker does a good job of searching multiple sites and mapping the data back to the user in visual form.
...a web-based enterprise search management platform that leverages the power of federated content access and visualization to maximize the value of information assets for enterprises, content publishers, libraries and other research-intensive organizations.

Thursday, November 8, 2007

Flight Explorer Snapshot


Reader submission (thanks Karen).

On the NATCA (National Air Traffic Controllers Association) website is this U.S. map showing every airline flight currently in the air. The information is delayed by 5 minutes. Also, the graphic isn't interactive, so you can see any information about the dots (like which flight it is).


You can also zoom into nine select cities to see the flights in the air and the flight numbers. So the next time you're lying in the grass with your kids (in one of the major cities) looking up at the sky, you could (if you wanted to) figure out where that airplane is going.

See also: Flight Patterns

Monday, November 5, 2007

Visuwords


Visuwords is a new website that visually shows the relationships between words. More than an online dictionary or thesaurus. The relationships are shown graphically like a mind-map.
Visuwords™ online graphical dictionary — Look up words to find their meanings and associations with other words and concepts. Produce diagrams reminiscent of a neural net. Learn how words associate.
Found on LifeHacker.

Infographic Video Advertisement


Found on Uswim, a French company developed an ad campaign around the infographic video style we saw in the Royksopp video.
It had such an impact that a few years later Areva, the French nuclear giant, wanted to use it for their advertising. Being denied it by the Norwegian pop group they finally went for the hit "Funky Town" on a video that looks very similar (as it was done by the same French art collectif H5 that did Royksopp's video).

Their objective was to show Areva's expertise in the energy sector (see their corresponding website using Flash animation) as part of the branding campaign of a company anticipating to go private (still waiting because of internal French politics). The choice of animated graphics was to reinforce the educative aspect on Areva's business and avoid the harsh reality of images of nuclear plants. In a way the almost childish graphics (almost like a comic strip) make it look like a video game of some sort, some kind of SimCity. It was very successful and the idea was again used in a slightly different angle (accelerated special effects video) by EDF (another French energy giant) in a commercial
I found the link to Uswim on Simple Complexity.

Friday, November 2, 2007

The World Freedom Atlas


The World Freedom Atlas, offers many different views of the world. Developed by Zachary Forest Johnson, his blog is here. The one above is the Raw Political Rights Score (darker is better) based on data from the Freedom House. Offering a bunch of datasets from a number of different sources, the interface is fantastically easy to use. Depending on the dataset, you can also view the data by year from 1990-2006.

The President's Entourage


Found on Digg, a quick graphic showing the massive entourage that travels with the President.

Wednesday, October 31, 2007

Stranger Than Fiction


This video is the introduction to the movie Stranger Than Fiction, full of infographics. It's been around for a while, but I thought I would share it too.

Tuesday, October 30, 2007

Lotteries Profit, but Do Students?


Interactive graphic, from the NYTimes:
Lotteries in 42 states and the District of Columbia rake in billions of dollars, but much of the cash from ticket sales gets channeled back into prizes and lottery administration. States earmark the profits for programs like education, but the lottery dollars contribute only a small percentage of the total education funding.

Sunday, October 28, 2007

Where we live...


Found on Data Mining, this is an interactive graphic from Time magazine showing the population density in America as a histogram. Similar to my earlier post on World Population Density, this one focuses on just America, and adds the 3d element to the visual.

Friday, October 26, 2007

Who Owns the Media Companies?


Similar to my earlier post about Who Owns the Car Companies?, I found that Advertising Age magazine has created a poster showing the ownership in the media companies.

You thought the car companies were complicated...

Science Related Wikipedian Activity


A new visualization from the same group that did the earlier visualization of Wikipedia revision activity. This one focused on science and tech related articles. The mystery is the significance of the blue/green band that crosses the map.

Thursday, October 25, 2007

Map of the Internet (blacklisted)

Found on Information Aesthetics, this is a map of all 4,294,967,296 IP addresses in the world. Blocks of addresses are shown grouped together in squares based on the owner (ISP, corporation, goverment, university, etc.), and individual addresses are shown as grey dots. The IP addresses that are listed on the Spamhaus XBL blacklist are shown as red dots, representing suspect addresses.

Tuesday, October 23, 2007

Who Owns the Car Companies?

I found three different images showing the complex network of ownership between the automotive companies. Three different attempts at making these complex relationships easier to understand. This first one is a scan from a magazine, but I can't find any reference to which actual magazine it came from. Charted out like a subway map, it's pretty easy to follow.

This next one from Too Many Cars is charted like a family tree, or a mind map. It's the easiest the follow, but probably the least aesthetically pleasing. Online the image is broken into smaller pictures so you can zoom closer, but is also available as a large poster in PNG or PDF formats. The data for this one is from 2006, and is the most current of the three.


This last graphic claims to show the ownership mix in the auto industry as a form of bubble chart, but I can't find any date or source data link. I think the bubble sizes represent something, like size of the company or ownership, but I can't tell. So I can't tell how accurate this is. The image is on Tinypic.

Monday, October 22, 2007

Wikipedia Activity Visualization


From A Beautiful WWW, this image is a pretty good attempt to visualize the article revision activity on Wikipedia. An article explaining the visualization is here, but the image is a combination of images are from the most linked-to articles, and the size of the colored dots represent the amount of revision activity in the linked articles.

A really cool interactive version was made using the Google Maps API so you can zoom in and move around the graphic.

Friday, October 19, 2007

Infographic Music Video


A complete music video made of infographics! It's pretty good too! The song is "Remind Me" by Royksopp, and the video continuously blends one infographic into the next. Let's hope real life is more than a series of graphics about the choices we make.

Found on the Data Mining blog.

The Flu Virus


Flu season is coming soon, so its about time to know your enemy. Graphic of the Flu virus from newscientist.com.

Kinda looks like a big squishy ball doesn't it?

Thursday, October 18, 2007

Plastic Bags


Here's another one from Chris Jordan. Is it art, or is it infographic?

The image shows 60,000 plastic bags, which is how many bags are used in the U.S. every 5 seconds! The picture currently on display at the Paul Kopeikin Gallery in Los Angeles is 5ft x 6ft large so viewers can step up close to see all of the details.

Wednesday, October 17, 2007

Americans Remain Woefully Ill-Informed


Wired magazine calls infographics like this "infoporn". I guess you could call this a version of a bubble chart, but it shows a comparison of what people knew in 1989 vs. 2007. Separately it shows knowledge of three questions based on the respondent's usual source of news.

I can't tell how big the sample size was, or what type of people they interviewed. It quotes the source as the Pew Research Center for the People & the Press, but that alone isn't enough to make it credible.

Monday, October 15, 2007

Potential Solar Energy


Submitted by a reader (thanks Louis), this infographic is from Good Magazine. Of course there isn't actually a way to capture ALL of the light from the sun, but it is indicative that we should be able to capture more than we do.

Check out this link at Good Magazine for a few other infographics too.

Sunday, October 14, 2007

Nip and Tuck


From Many Eyes, this bubble chart shows the number of plastic surgery procedures per 100 people, by nation. Let's just say, the U.S. is one of the smaller countries measured this way.

Friday, October 12, 2007

Radial Organization Chart

Found on Visual Complexity, this chart from 1924 is an interesting variation of an organization chart. With the authoritarian leader in the center, the subordinates are mapped outward from the center. Rings at different radii show peer level responsibility.

Tuesday, October 9, 2007

WiFi Detector T-Shirt

Another one for the "real world" infographics. This t-shirt from ThinkGeek will detect WiFi 802.11b or 802.11g wireless networks and display their signal strength on the front of the shirt. A great Christmas present for the geek in your family, for only $30.

It will amuse you, that I caught this one from Guy Kawasaki on Twitter.com, which linked to Truemors.com, which linked to BoingBoing.com, which linked to BoingBoingGadgets which finally linked to the original page on ThinkGeek.com. What a tangled web we weave...

Monday, October 8, 2007

Population Heat Map


From CraigStats, the image above shows the population per square mile in the San Francisco area as a pseudo heat map. The site also has combined the apartment listings on Craig's List with Google maps to create pseudo heat maps showing the areas with the most apartments.

Saturday, October 6, 2007

Flight Patterns


The images at Flight Patterns are really cool, but the videos are awesome (I think my favorite is the color coded)! Created by Aaron Koblin at UCLA, he took the daily flight data from the FAA and plotted the flight paths over the U.S. over time.

Found on Visual Complexity.

Thursday, October 4, 2007

Breathing Earth


Breathing Earth is a cool website that displays international statistics in real-time, similar in concept to Poodwaddle.com's World Counter. Breathing Earth focuses on carbon dioxide emissions by country and adds population, births and deaths.
Welcome to Breathing Earth. This presentation displays the carbon dioxide emission levels of every country in the world, as well as their birth and death rates - all in real-time. Though considerable effort has been taken to ensure that the presentation uses the most accurate and up-to-date data available, please remember that this is just a simulation.
Breathing Earth was created by David Bleja (aka Stillwater), whose home website is stillwater-microcosm.net

Found on SimpleComplexity.net